For qc_report_indiv, the following types of plots are available:
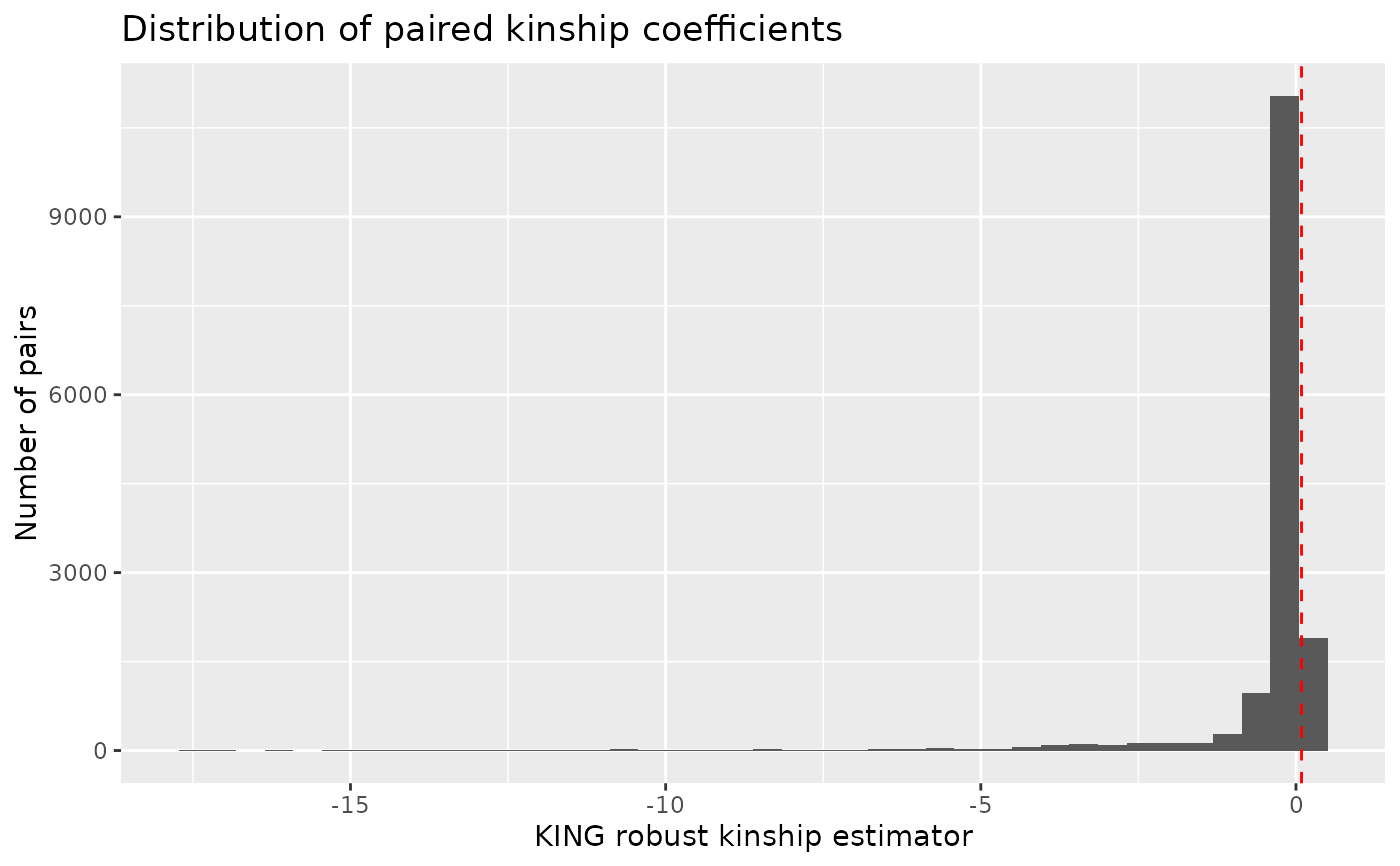
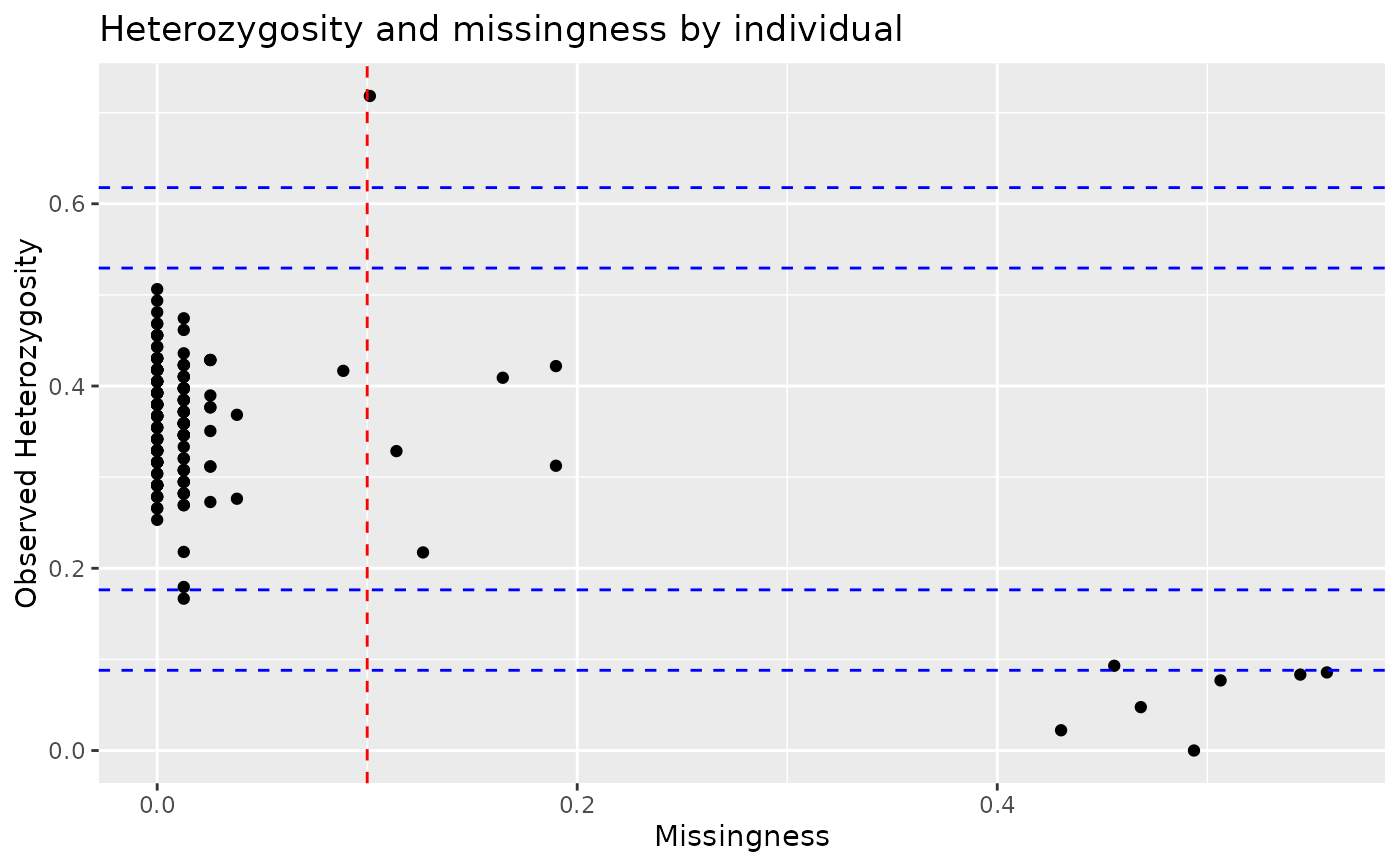
scatter: a plot of missingness and observed heterozygosity within individuals.relatedness: a histogram of paired kinship coefficientshistogram: for gen_tibbles containing pseudohaploid data, a histogram of missingness, split by ploidy.
Details
autoplot produces simple plots to quickly inspect an object. They are not
customisable; we recommend that you use ggplot2 to produce publication
ready plots.
Examples
# Create a gen_tibble of lobster genotypes
bed_file <-
  system.file("extdata", "lobster", "lobster.bed", package = "tidypopgen")
example_gt <- gen_tibble(bed_file,
  backingfile = tempfile("lobsters"),
  quiet = TRUE
)

# Create QC report for individuals
indiv_report <- example_gt %>% qc_report_indiv()

# Autoplot missingness and observed heterozygosity
autoplot(indiv_report, type = "scatter", miss_threshold = 0.1)


# Create QC report with kinship filtering
indiv_report_rel <-
  example_gt %>% qc_report_indiv(kings_threshold = "second")

# Autoplot relatedness
autoplot(indiv_report_rel, type = "relatedness", kings_threshold = "second")
#> Warning: Removed 178 rows containing non-finite outside the scale range (`stat_bin()`).
# Create QC report with kinship filtering
indiv_report_rel <-
example_gt %>% qc_report_indiv(kings_threshold = "second")
# Autoplot relatedness
autoplot(indiv_report_rel, type = "relatedness", kings_threshold = "second")
#> Warning: Removed 178 rows containing non-finite outside the scale range (`stat_bin()`).