For gt_dapc, the following types of plots are available:
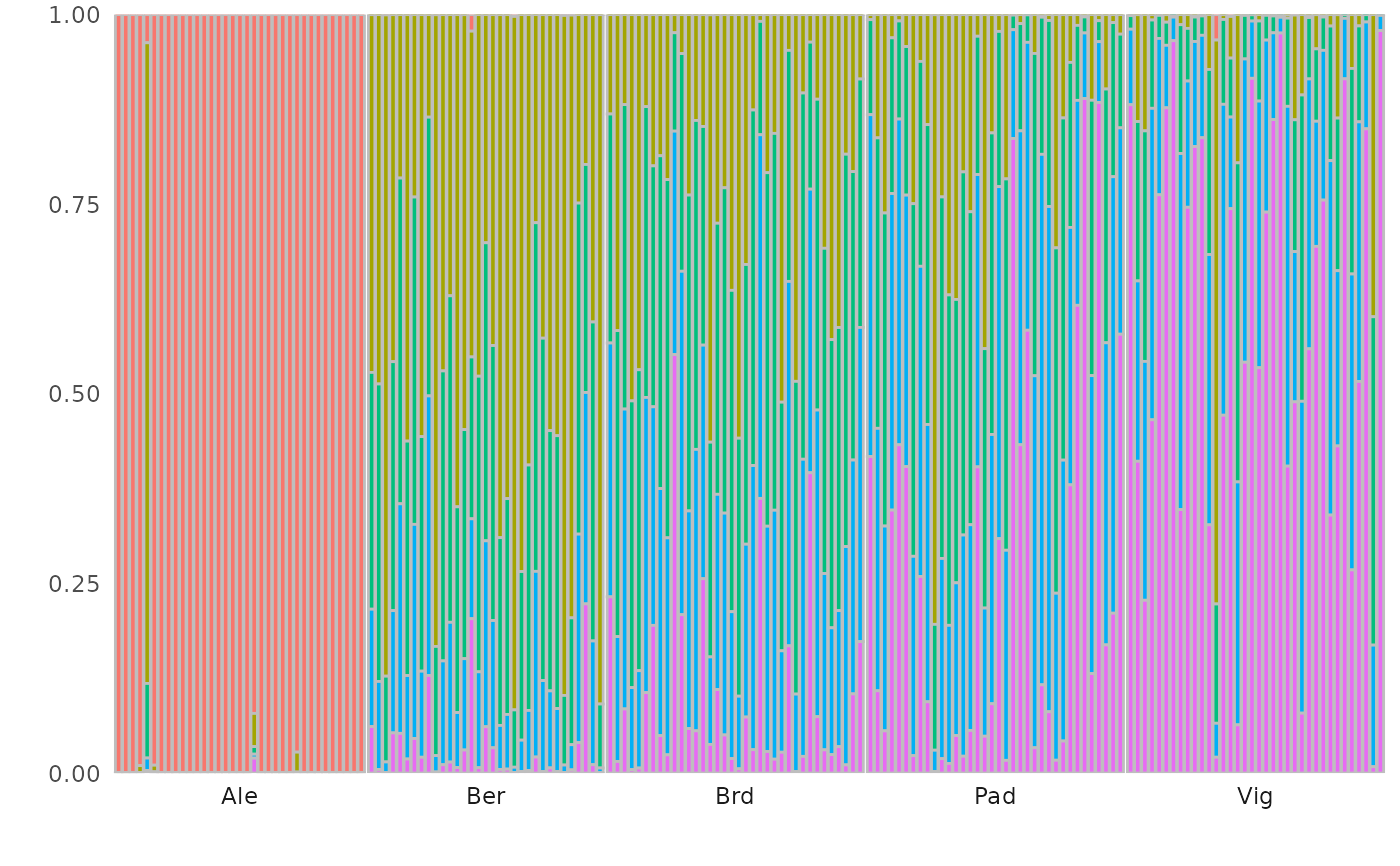
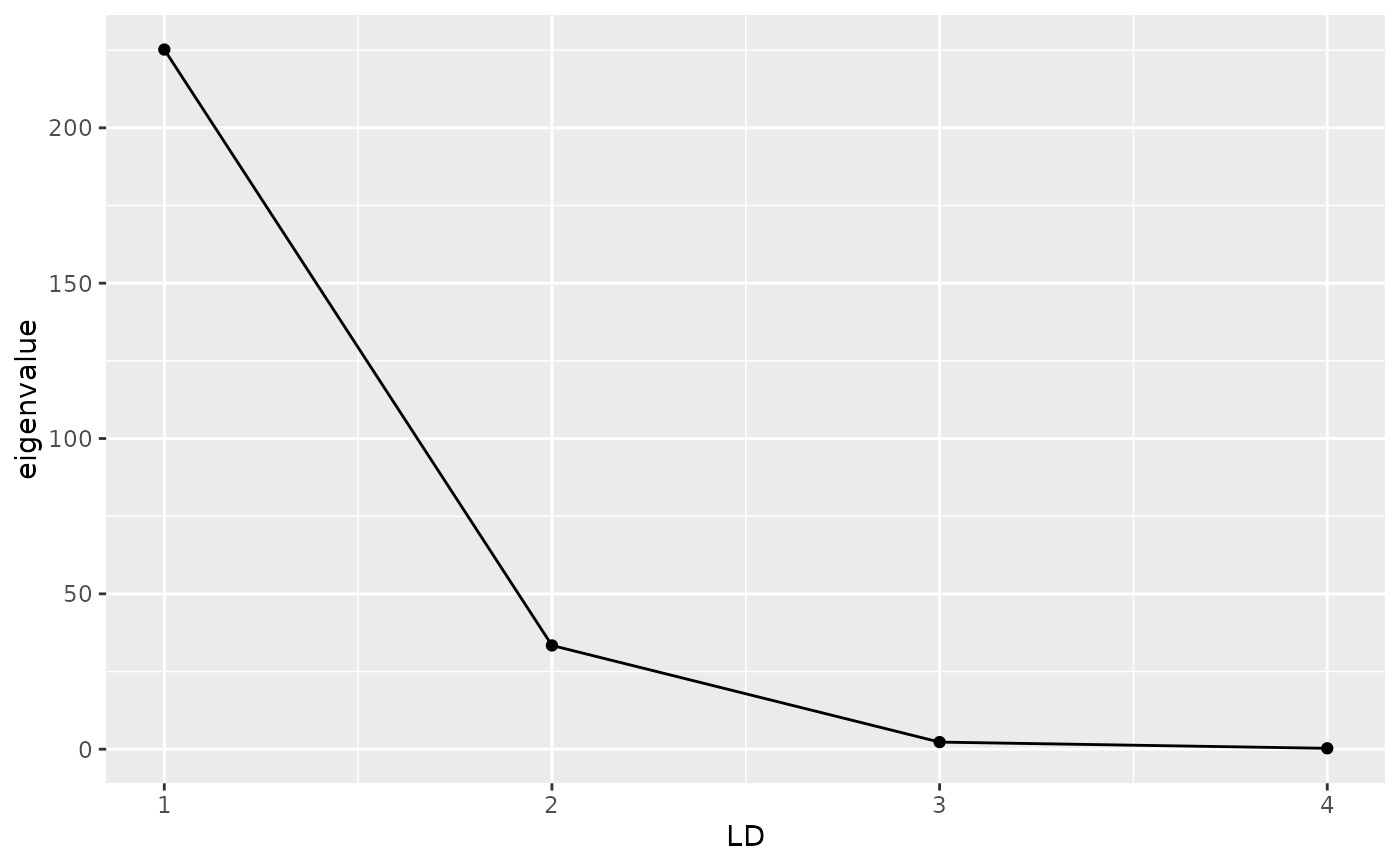
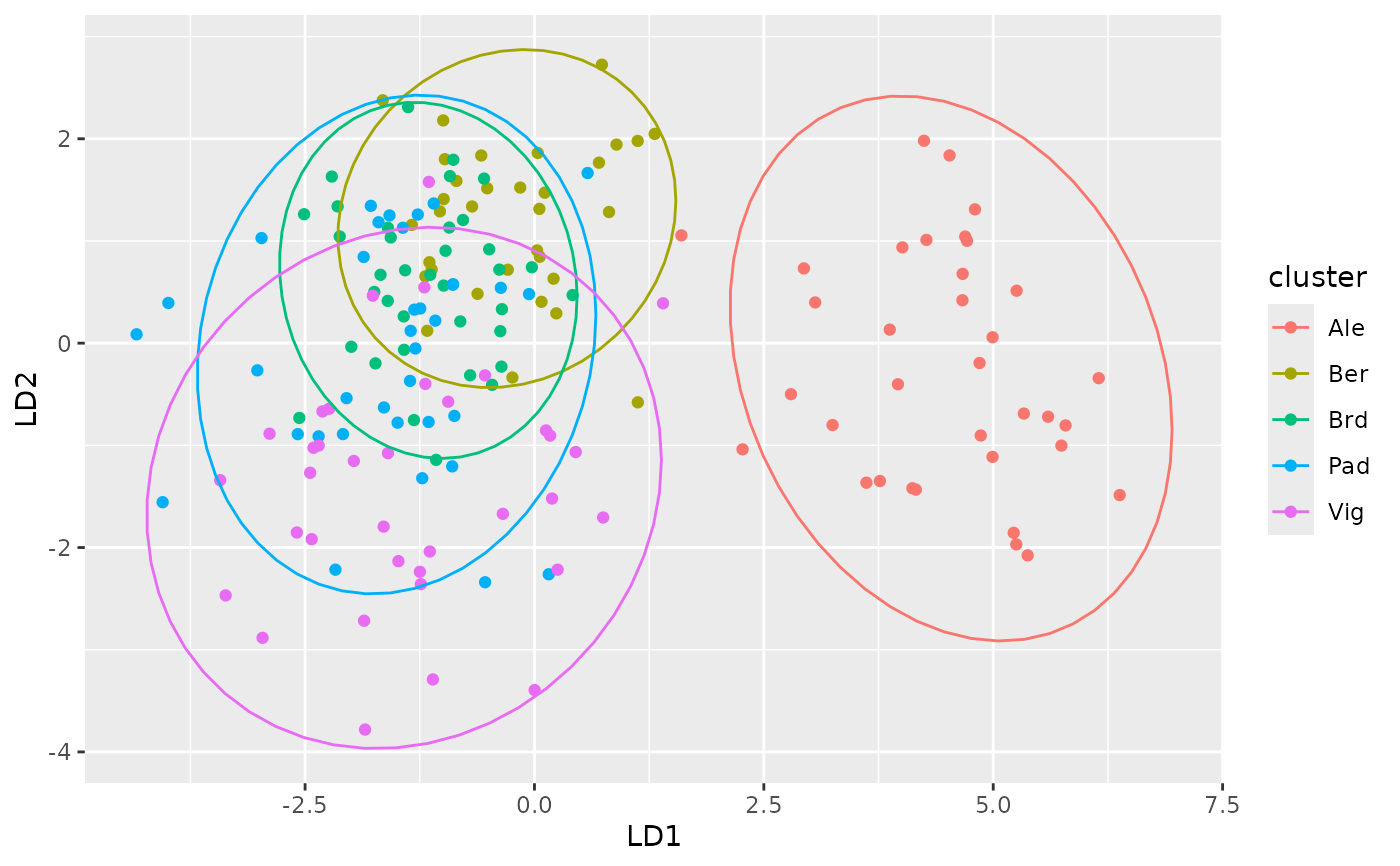
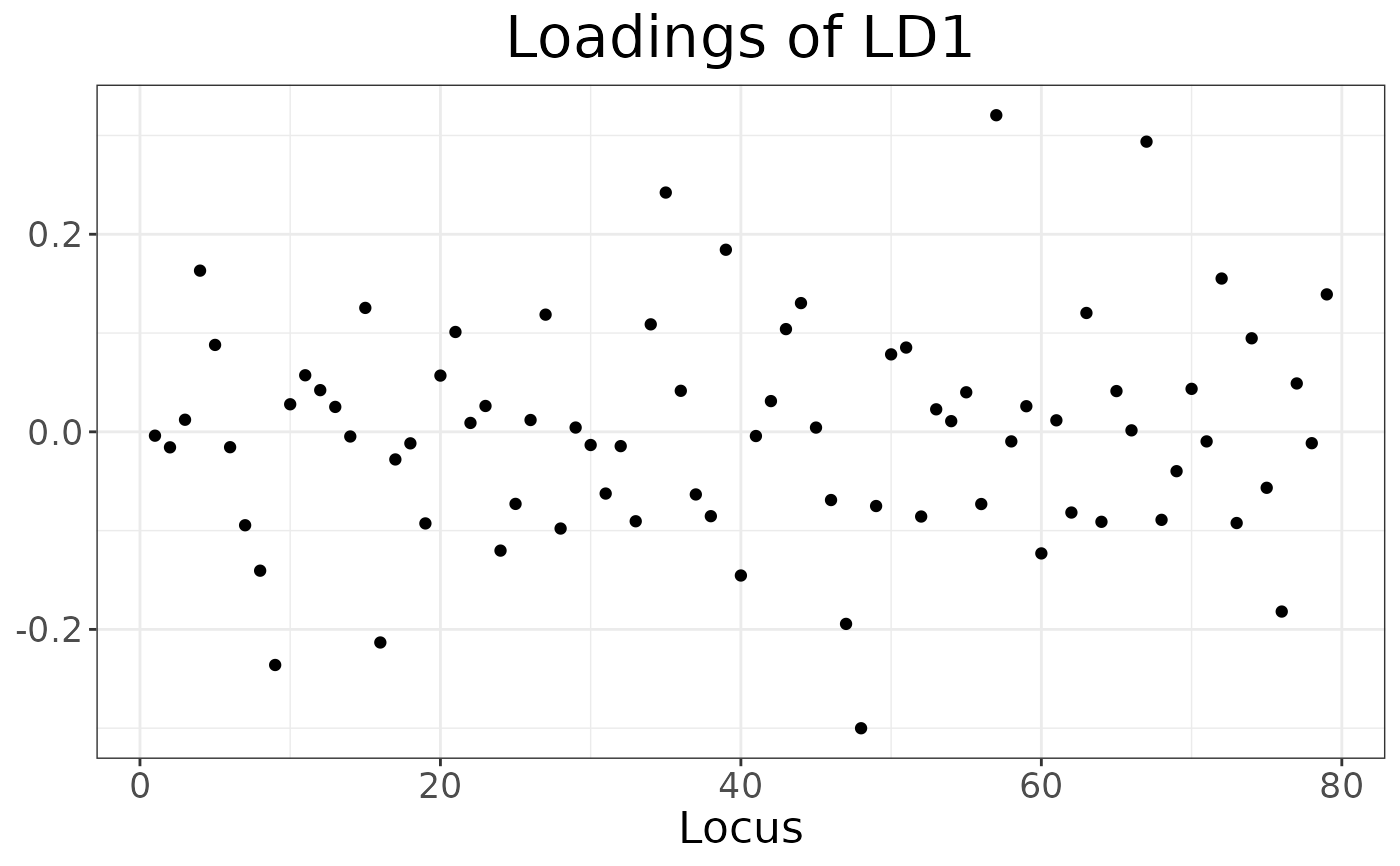
screeplot: a plot of the eigenvalues of the discriminant axesscoresa scatterplot of the scores of each individual on two discriminant axes (defined byld)loadingsa plot of loadings of all loci for a discriminant axis (chosen withld)componentsa bar plot showing the probability of assignment to each cluster
Arguments
- object
an object of class
gt_dapc- type
the type of plot (one of "screeplot", "scores", "loadings", and "components")
- ld
the principal components to be plotted: for scores, a pair of values e.g. c(1,2); for
loadingseither one or more values.- group
a vector of group memberships to order the individuals in "components" plot. If NULL, the clusters used for the DAPC will be used.
- n_col
for
loadingsplots, if multiple LD axis are plotted, how many columns should be used.- ...
not currently used.
Details
autoplot produces simple plots to quickly inspect an object. They are not
customisable; we recommend that you use ggplot2 to produce publication
ready plots.
Examples
# Create a gen_tibble of lobster genotypes
bed_file <-
system.file("extdata", "lobster", "lobster.bed", package = "tidypopgen")
lobsters <- gen_tibble(bed_file,
backingfile = tempfile("lobsters"),
quiet = TRUE
)
# Remove monomorphic loci and impute
lobsters <- lobsters %>% select_loci_if(loci_maf(genotypes) > 0)
lobsters <- gt_impute_simple(lobsters, method = "mode")
# Create PCA and run DAPC
pca <- gt_pca_partialSVD(lobsters)
populations <- as.factor(lobsters$population)
dapc_res <- gt_dapc(pca, n_pca = 6, n_da = 2, pop = populations)
# Screeplot
autoplot(dapc_res, type = "screeplot")
 # Scores plot
autoplot(dapc_res, type = "scores", ld = c(1, 2))
# Scores plot
autoplot(dapc_res, type = "scores", ld = c(1, 2))
 # Loadings plot
autoplot(dapc_res, type = "loadings", ld = 1)
# Loadings plot
autoplot(dapc_res, type = "loadings", ld = 1)
 # Components plot
autoplot(dapc_res, type = "components", group = populations)
#> Warning: Ignoring unknown parameters: `size`
# Components plot
autoplot(dapc_res, type = "components", group = populations)
#> Warning: Ignoring unknown parameters: `size`