For gt_pcadapt, the following types of plots are available:
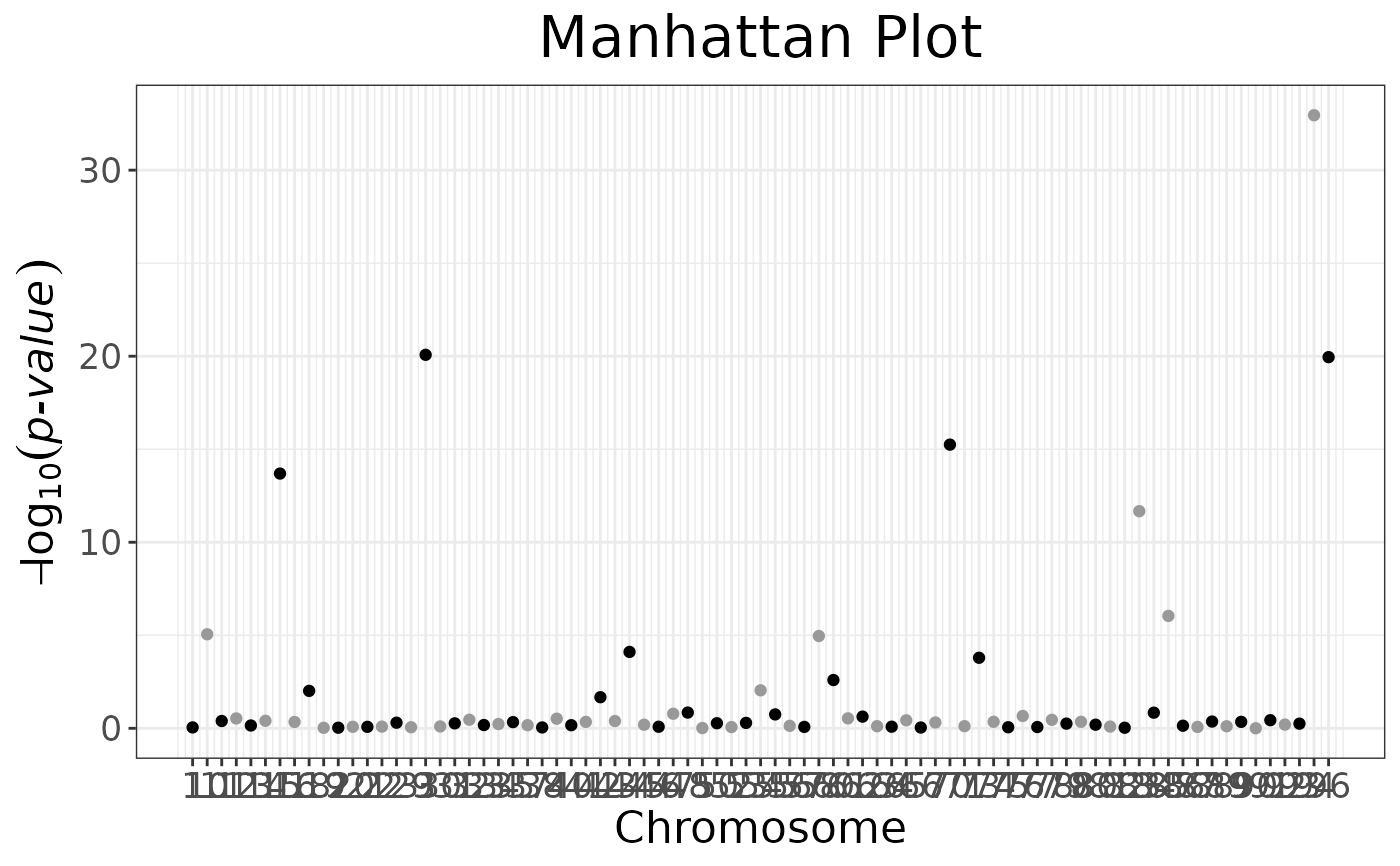
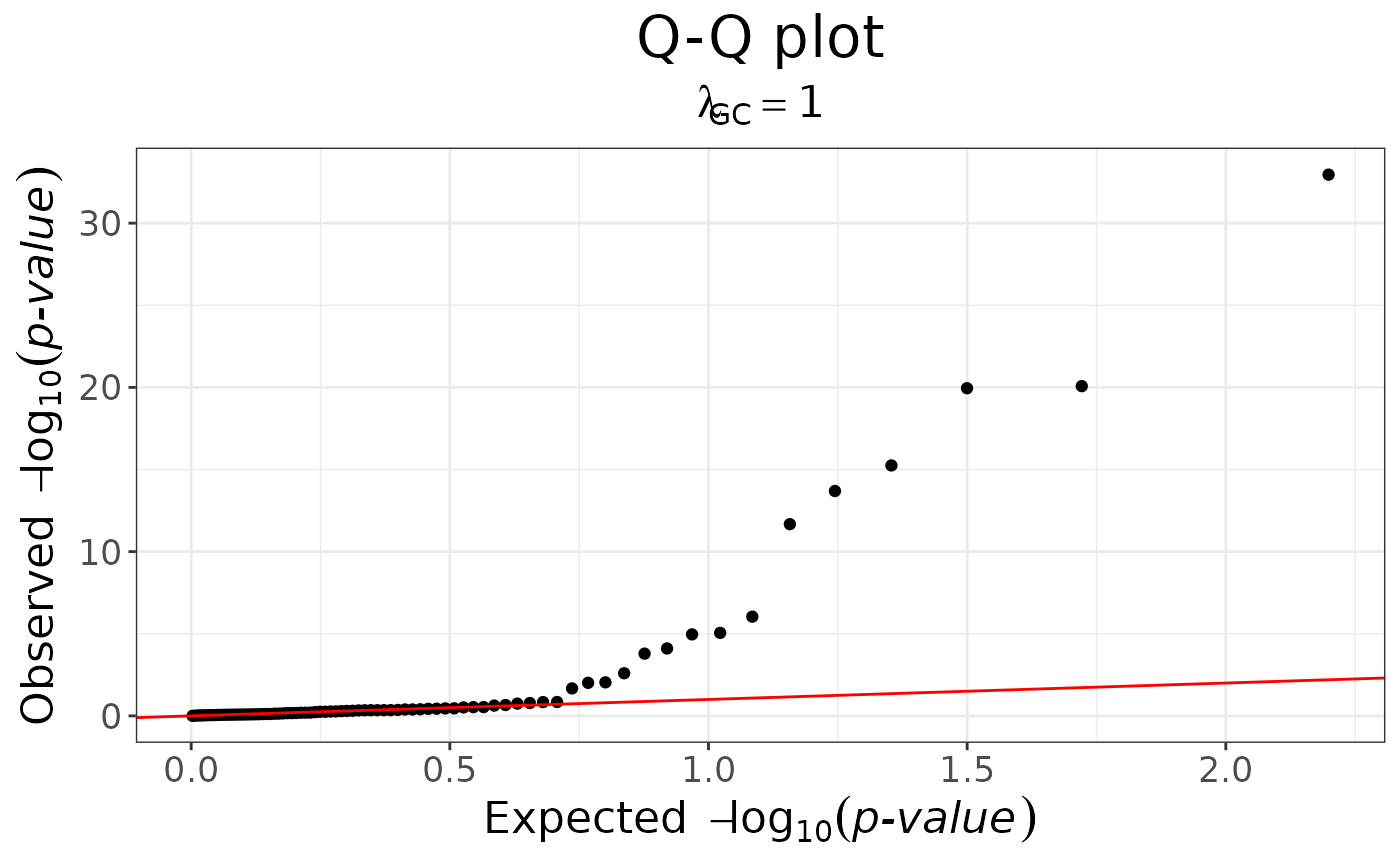
qq: a quantile-quantile plot of the p-values frompcadapt(wrappingbigsnpr::snp_qq())manhattana manhattan plot of the p-values frompcadapt(wrappingbigsnpr::snp_manhattan())
Arguments
- object
an object of class
gt_pcadapt- type
the type of plot (one of "qq", and "manhattan")
- ...
further arguments to be passed to
bigsnpr::snp_qq()orbigsnpr::snp_manhattan().
Details
autoplot produces simple plots to quickly inspect an object. They are
not customisable; we recommend that you use ggplot2 to produce publication
ready plots.
Examples
# Create a gen_tibble of lobster genotypes
bed_file <-
  system.file("extdata", "lobster", "lobster.bed", package = "tidypopgen")
lobsters <- gen_tibble(bed_file,
  backingfile = tempfile("lobsters"),
  quiet = TRUE
)

# Remove monomorphic loci and impute
lobsters <- lobsters %>% select_loci_if(loci_maf(genotypes) > 0)
lobsters <- gt_impute_simple(lobsters, method = "mode")

# Create PCA object
pca <- gt_pca_partialSVD(lobsters)

# Create a gt_pcadapt object
pcadapt_obj <- gt_pcadapt(lobsters, pca, k = 2)

# Plot the p-values from pcadapt
autoplot(pcadapt_obj, type = "qq")


# Plot the manhattan plot of the p-values from pcadapt
autoplot(pcadapt_obj, type = "manhattan")
# Plot the manhattan plot of the p-values from pcadapt
autoplot(pcadapt_obj, type = "manhattan")