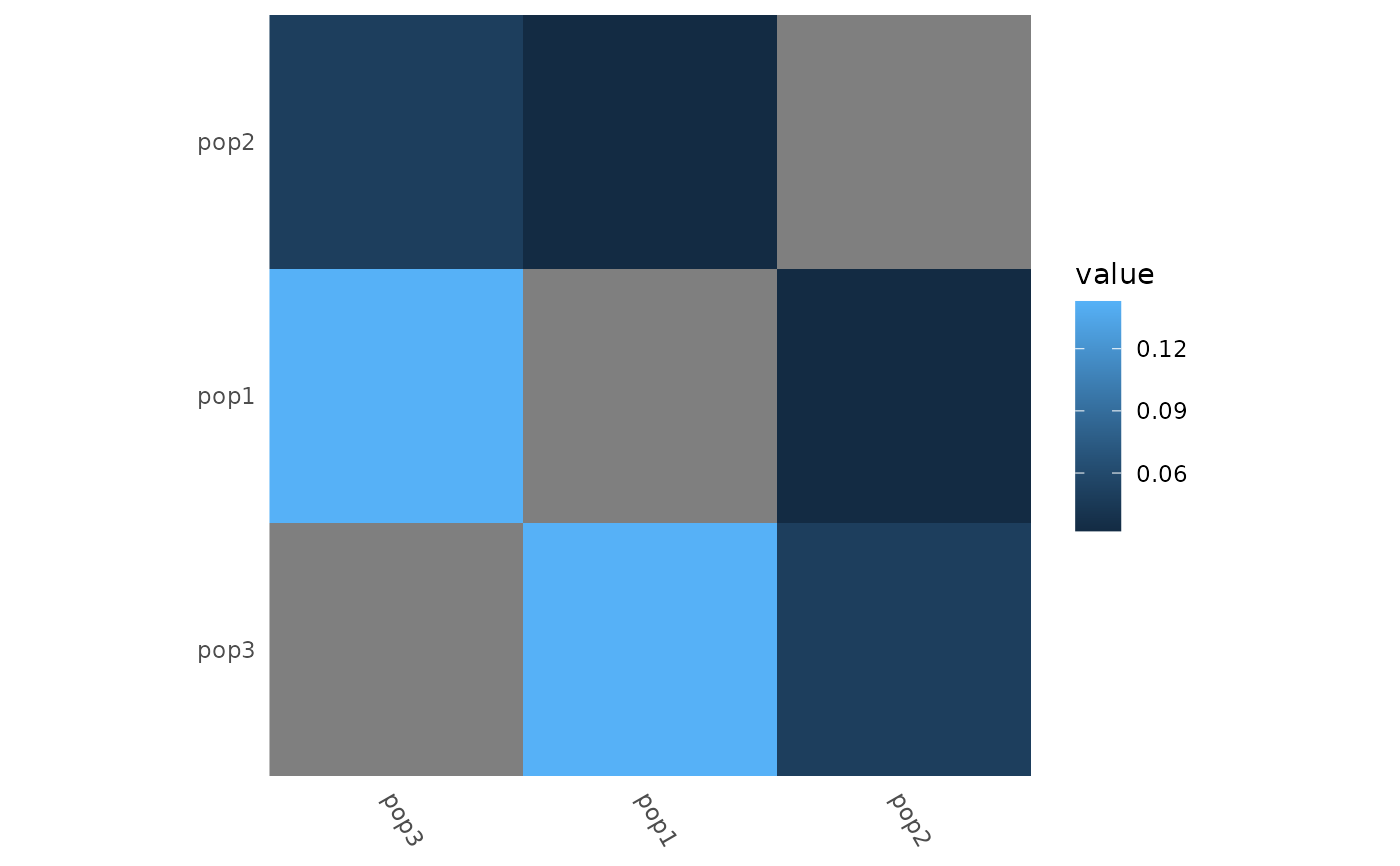
This function provides a convenient way to visualize pairwise distance matrices (e.g., Fst, IBS) as heatmaps using ggplot2. It supports both matrix and tidy tibble formats, and can optionally reorder rows/columns using either an explicit ordering vector or a function (e.g. hierarchical clustering).
Arguments
- object
A square numeric matrix OR a data.frame/tibble with 3 columns: names1, names2, value (half-matrix representation).
- order
Optional ordering specification. Can be:
NULL(default): preserve the existing order.A character vector containing all row/column names in the desired order.
A function taking the matrix as input and returning either:
an ordering vector of indices, or
an object with an
ordercomponent (e.g. fromstats::hclust()).
- ...
Additional arguments (not currently used). Included for compatibility with autoplot generic.
Examples
example_gt <- load_example_gt("gen_tbl")
# With a pairwise matrix:
fst_dist <- example_gt %>%
group_by(population) %>%
pairwise_pop_fst(method = "Nei87", type = "pairwise")
autoplot(fst_dist)
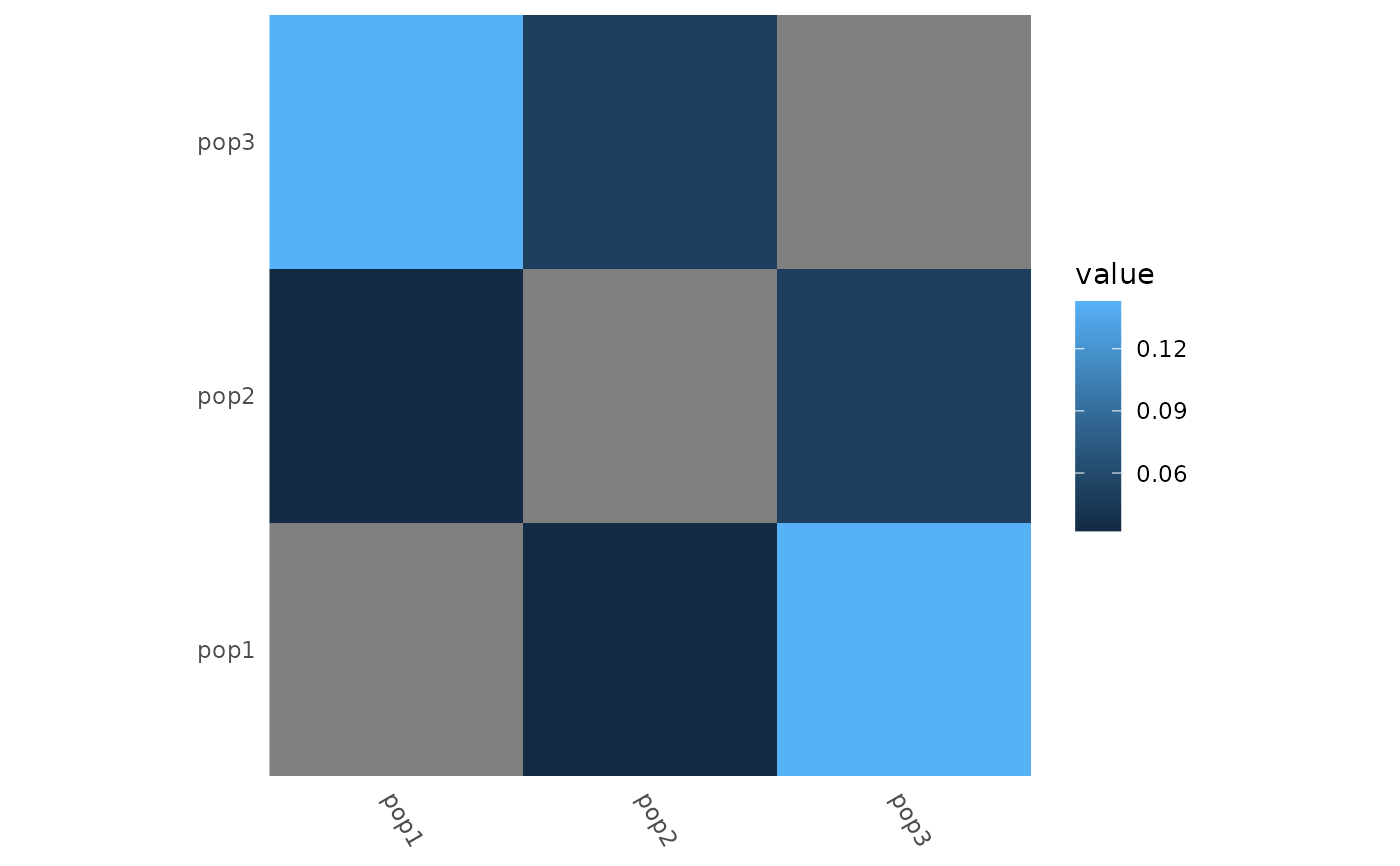 # Explicit ordering
autoplot(
fst_dist,
order = rev(rownames(fst_dist))
)
# Explicit ordering
autoplot(
fst_dist,
order = rev(rownames(fst_dist))
)
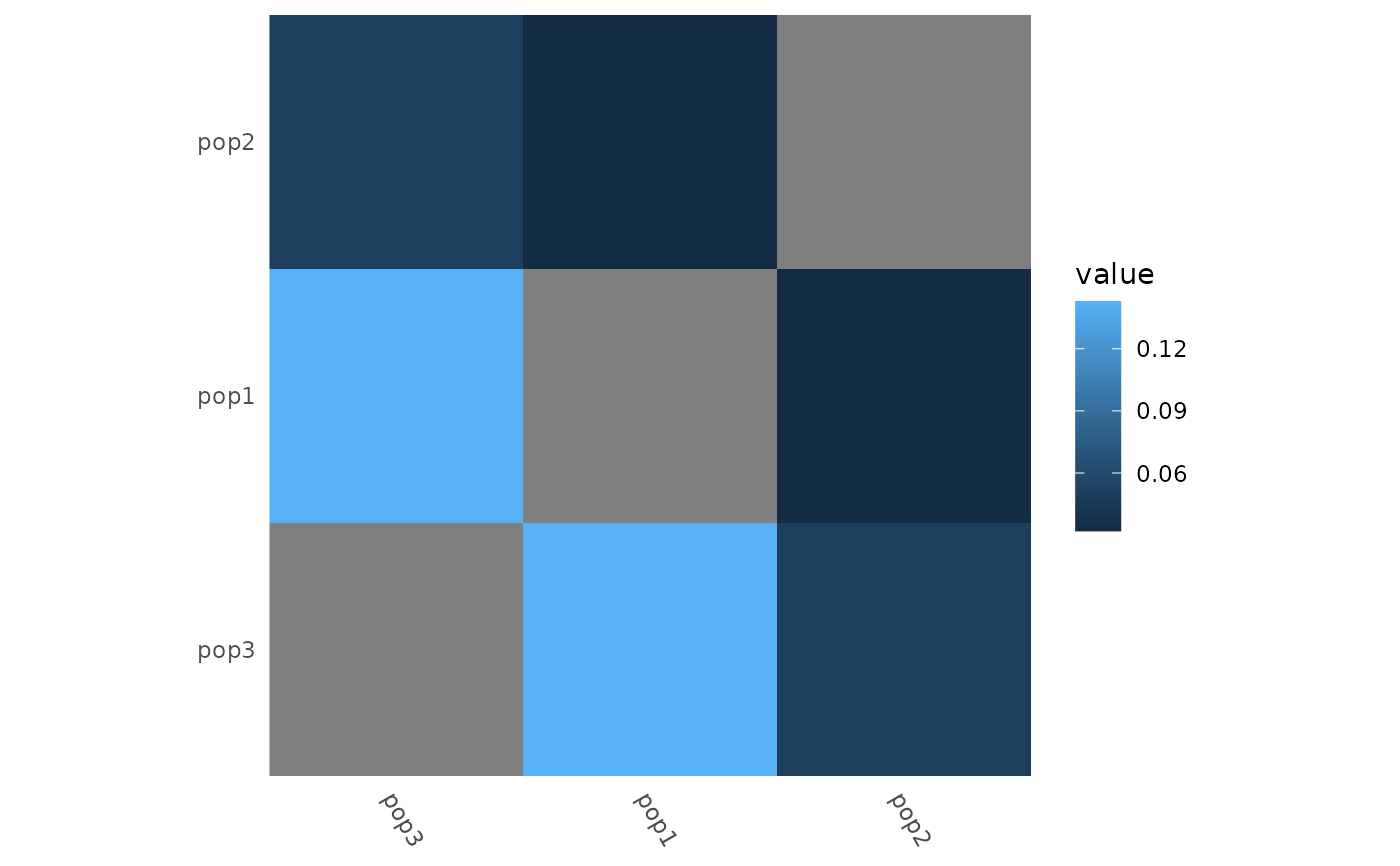
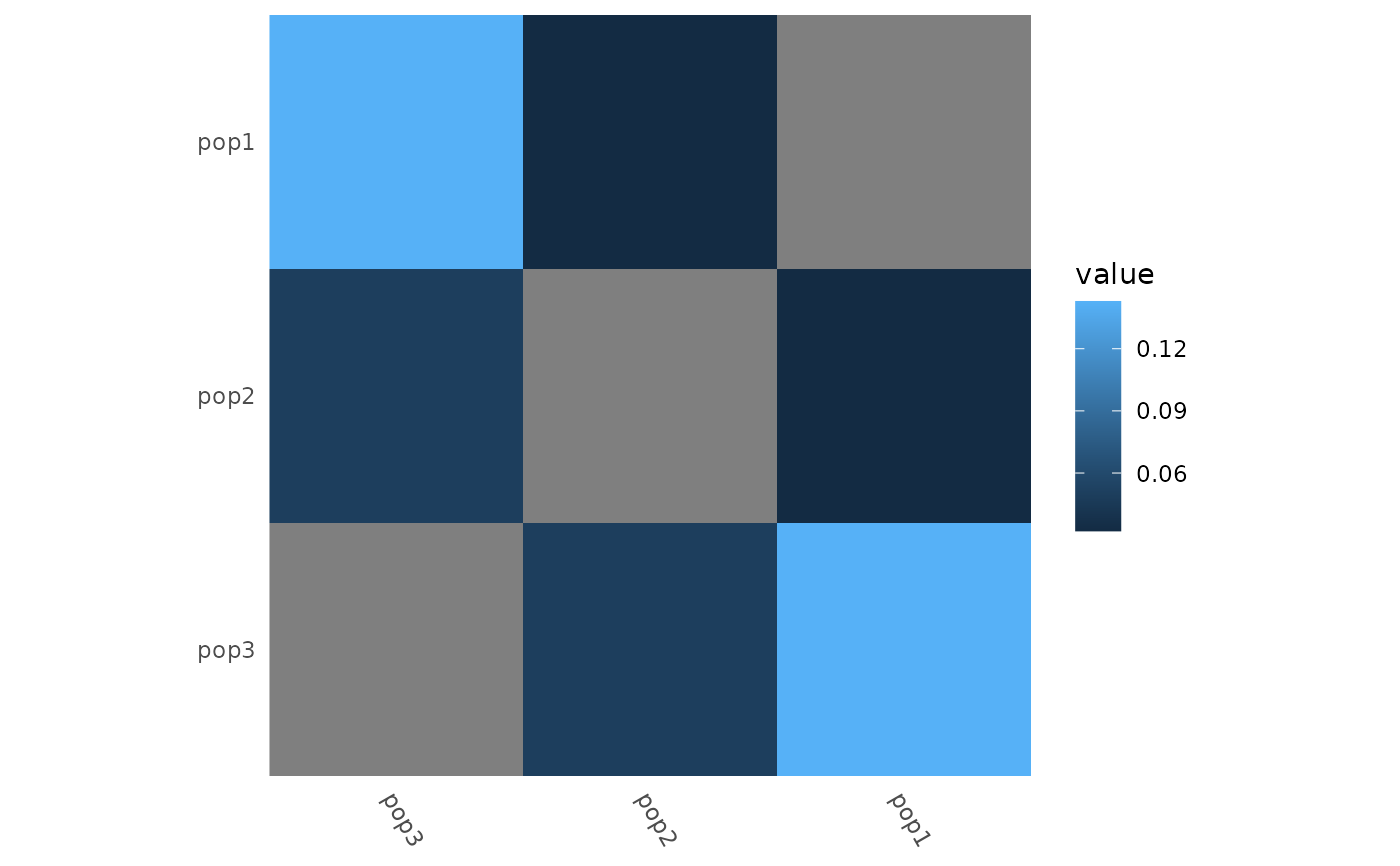 # Hierarchical clustering
autoplot(
fst_dist,
order = function(x) {
stats::hclust(stats::as.dist(x), method = "complete")
}
)
# Hierarchical clustering
autoplot(
fst_dist,
order = function(x) {
stats::hclust(stats::as.dist(x), method = "complete")
}
)
 # With a tidy tibble of distances:
fst_tidy <- example_gt %>%
group_by(population) %>%
pairwise_pop_fst(method = "Nei87", type = "tidy")
autoplot(fst_tidy)
# With a tidy tibble of distances:
fst_tidy <- example_gt %>%
group_by(population) %>%
pairwise_pop_fst(method = "Nei87", type = "tidy")
autoplot(fst_tidy)
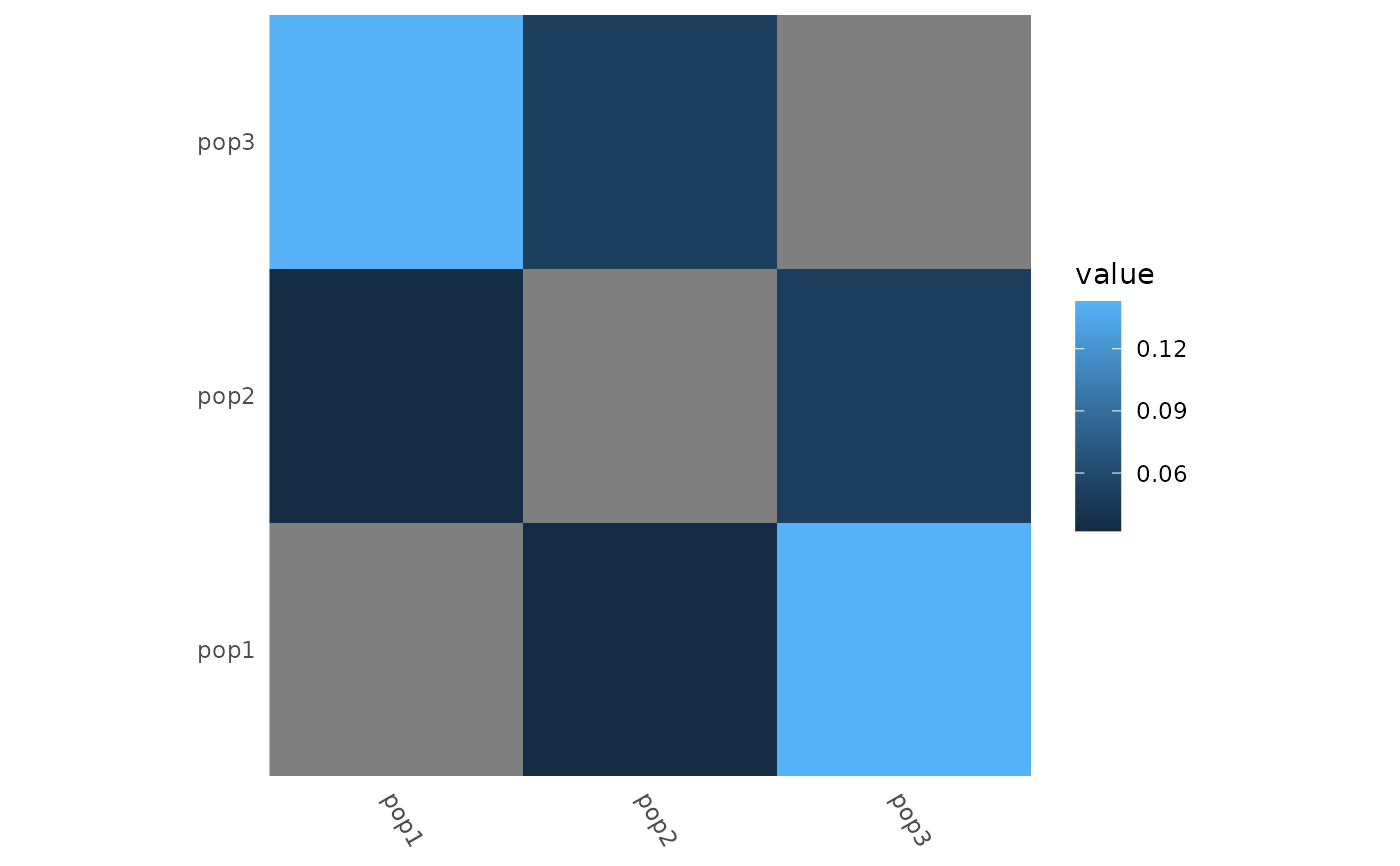 autoplot(
fst_tidy,
order = function(x) {
stats::hclust(stats::as.dist(x))
}
)
autoplot(
fst_tidy,
order = function(x) {
stats::hclust(stats::as.dist(x))
}
)