A wrapper around ggplot2::scale_fill_manual(), using the distruct colours
from distruct_colours.
Arguments
- guide
guide function passed to
ggplot2::scale_fill_manual(). Defaults to "none", set to "legend" if a legend is required.- ...
further parameters to be passed to
ggplot2::scale_fill_manual()
See also
ggplot2::scale_fill_manual() which this function wraps.
Examples
library(ggplot2)
# Create a gen_tibble of lobster genotypes
bed_file <-
system.file("extdata", "lobster", "lobster.bed", package = "tidypopgen")
lobsters <- gen_tibble(bed_file,
backingfile = tempfile("lobsters"),
quiet = TRUE
)
# Remove monomorphic loci and impute
lobsters <- lobsters %>% select_loci_if(loci_maf(genotypes) > 0)
lobsters <- gt_impute_simple(lobsters, method = "mode")
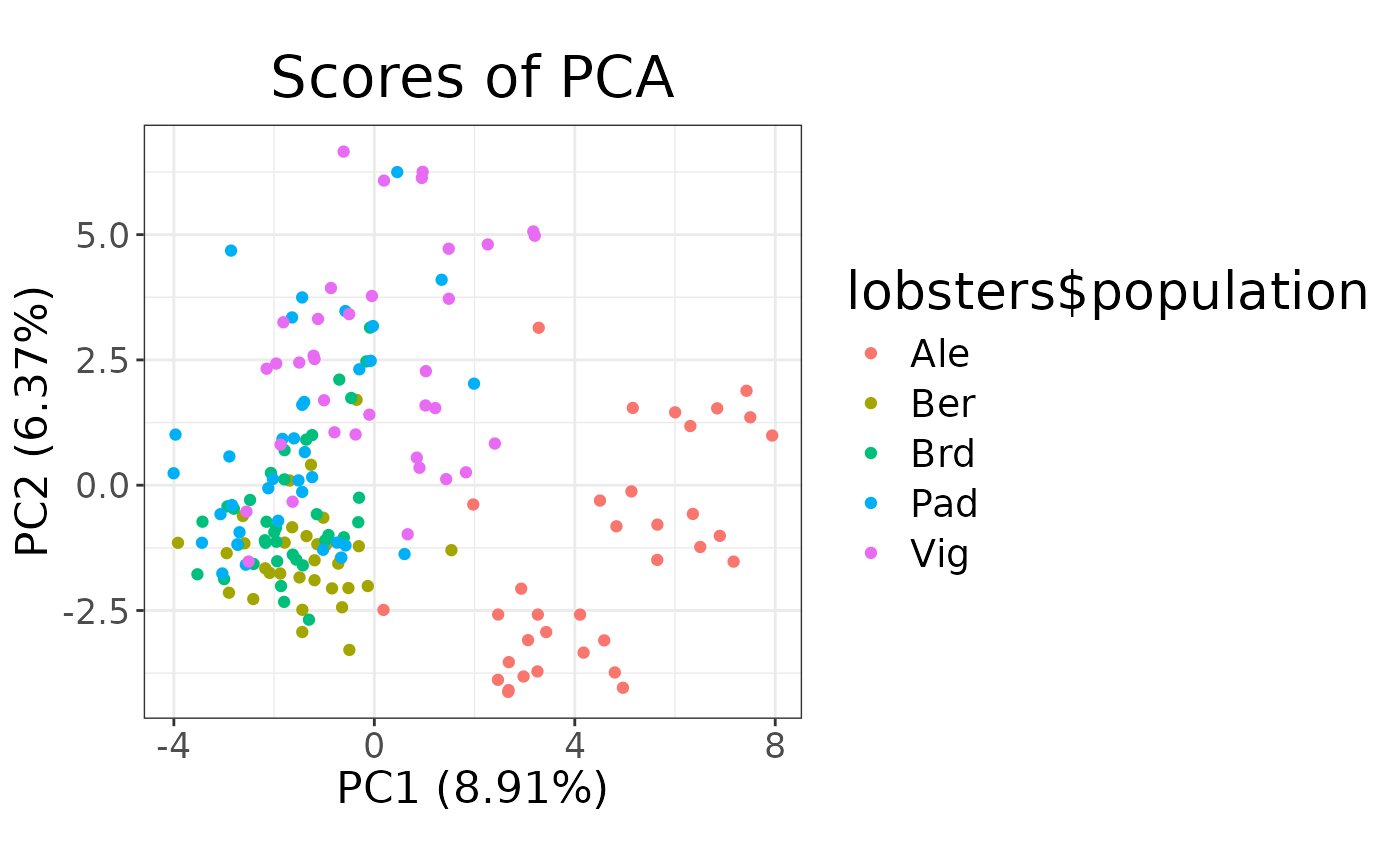
# Create PCA object
pca <- gt_pca_partialSVD(lobsters)
# Colour by population
autoplot(pca, type = "scores") +
aes(colour = lobsters$population) + scale_fill_distruct()