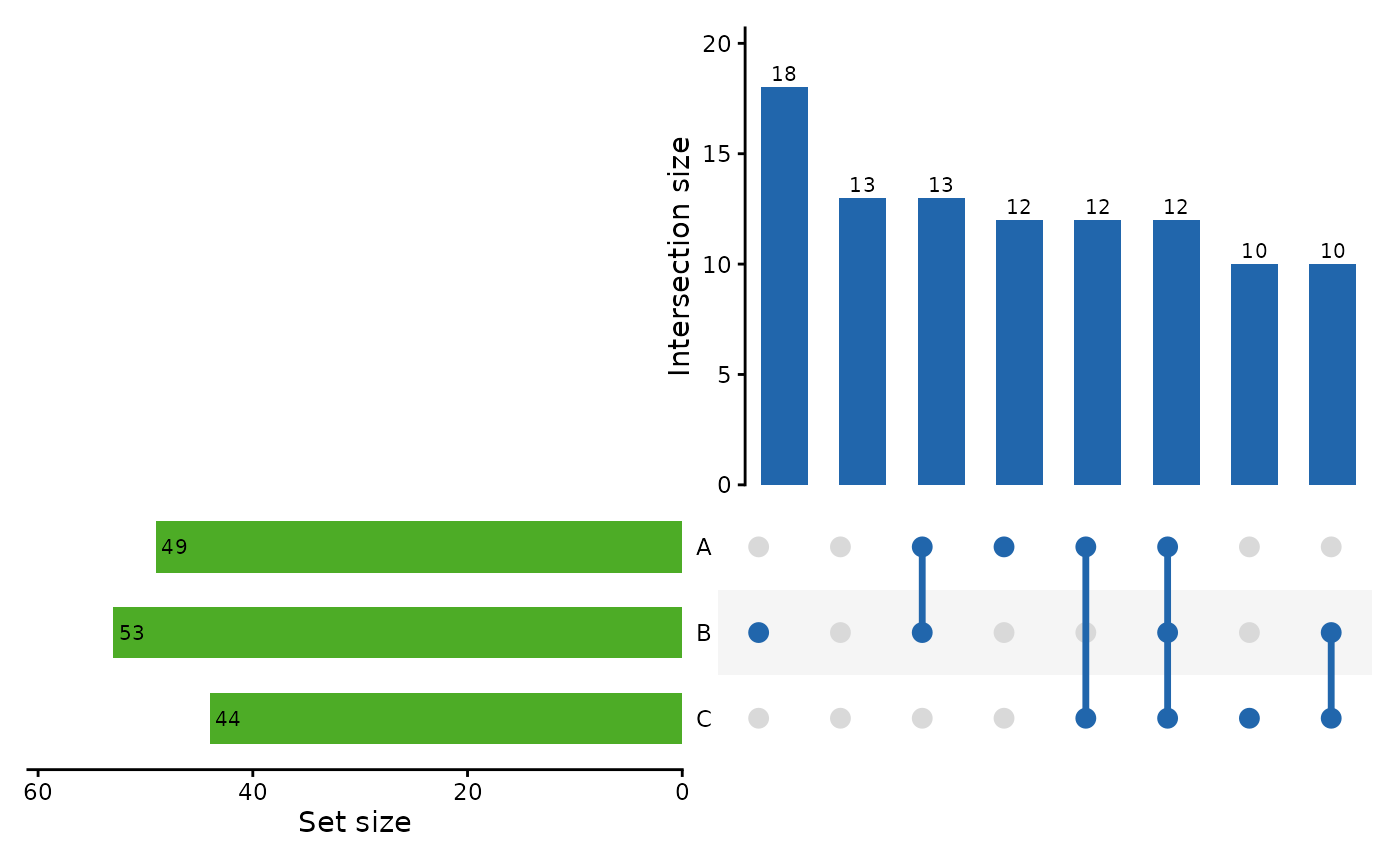
This is a minimalistic implementation of upset plots, as used to visualise
our qc_loci_report. It is not intended to be a general-purpose upset
plotting function, and it does not attempt to replicate all the features of
specialised packages. It produces a three-panel UpSet plot assembled with
patchwork:
Top panel - bar chart of intersection sizes, labelled.
Matrix panel - dot-and-line membership matrix with alternating row backgrounds for readability.
Left panel - horizontal bar chart of per-set totals.
Usage
upset_plot(
  df,
  sets = NULL,
  min_size = 1L,
  n_intersections = 40L,
  bar_colour = "#2166ac",
  dot_colour = "#2166ac",
  empty_colour = "#d9d9d9",
  set_bar_colour = "#4dac26",
  text_size = 11
)
Arguments
- df
A data frame with logical set-membership columns.
- sets
Character vector of column names to use as sets. Defaults to
NULL, in which case alllogicalcolumns are used automatically. The order ofsetscontrols the top-to-bottom row order in the matrix (first element appears at the top).- min_size
Integer. Intersections with fewer than this many rows are dropped. Default
1L.- n_intersections
Integer. Maximum number of intersections to display (top-n by count). Default
40L.- bar_colour
Fill colour for the intersection size bars. Default
"#2166ac".- dot_colour
Colour for filled dots and connecting lines in the membership matrix. Default
"#2166ac".- empty_colour
Colour for absent-set dots in the matrix. Default
"#d9d9d9".- set_bar_colour
Fill colour for the set-size bars. Default
"#4dac26".- text_size
Base font size (pts) passed to all
themecalls. Default11.