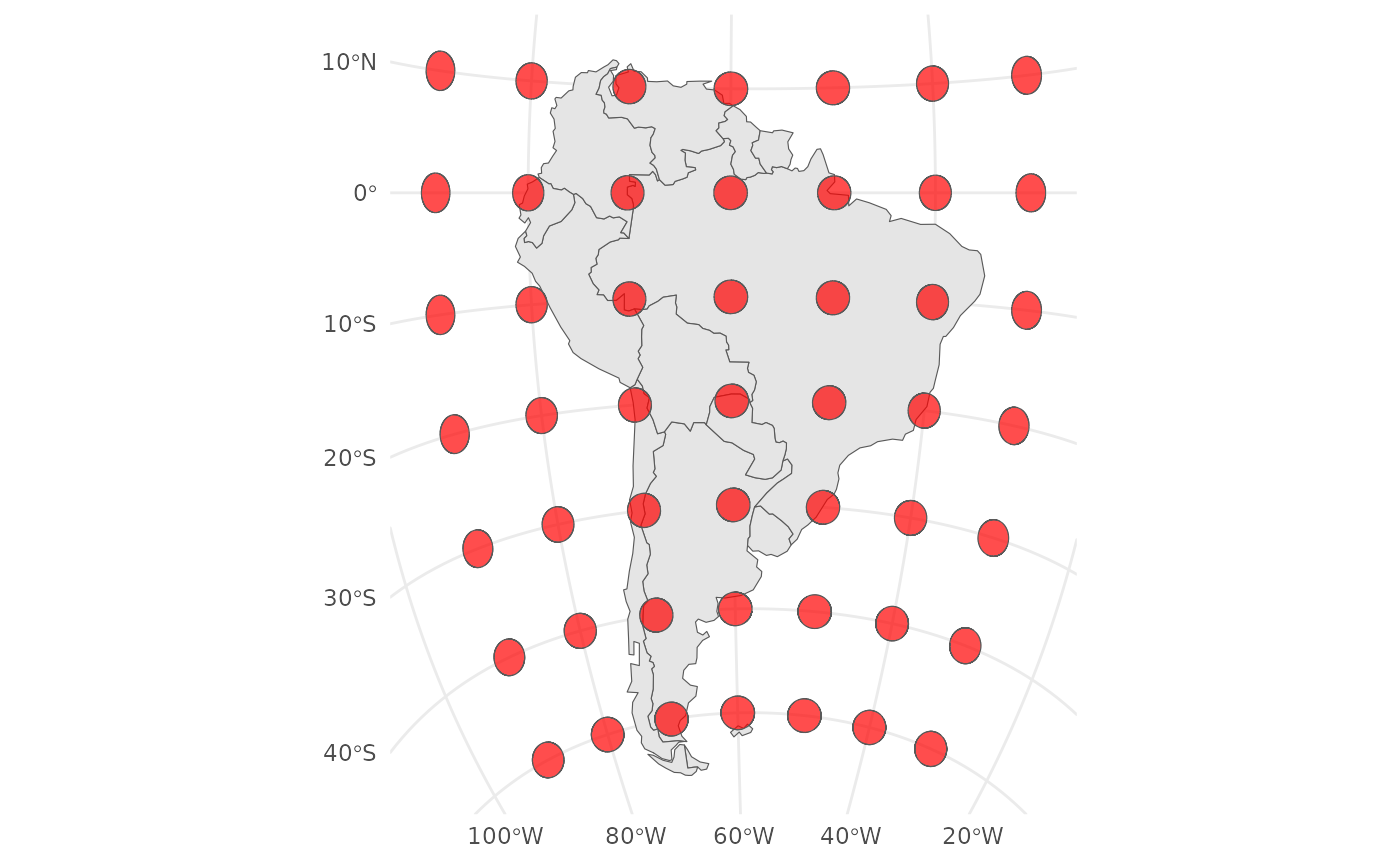
Add Tissot's indicatrix to a map
geom_tissot.RdThis function adds Tissot's indicatrix to a map. Tissot's indicatrix is a mathematical contrivance used in cartography to characterize local distortions due to map projection.
Arguments
- mapping
Set of aesthetic mappings created by
ggplot2::aes(). If specified and inherit.aes = TRUE (the default), it is combined with the default mapping at the top level of the plot. You must supply mapping if there is no plot mapping.- data
The data to be displayed in this layer. There are two options: A sf object or a SpatRaster object
- na.rm
If FALSE, the default, missing values are removed with a warning. If TRUE, missing values are silently removed.
- show.legend
logical. Should this layer be included in the legends? NA, the default, includes if any aesthetics are mapped. FALSE never includes, and TRUE always includes. It can also be a named logical vector to finely select the aesthetics to display.
- inherit.aes
If FALSE, overrides the default aesthetics, rather than combining with them. This is most useful for helper functions that define both data and aesthetics and shouldn't inherit behaviour from the default plot specification, e.g.
ggplot2::geom_point().- centres
Either a list with elements "lng" and "lat" giving the longitudes and latitudes of the grid of centres for the Tissot's indicatrix, or a vector of length 2 with the number of rows and columns to generate such a grid automatically. The latter is passed to
pretty()to get pretty breaks, and the exact number of Tissot's circles might differ from the input numbers (seepretty()for details. It defaults to c(5,5).- radius
The radius of the circles (see
sf::st_buffer()for an explanation of how units are created; we recommend that you explicitly state your using with theunits::as_units(), e.gunits::as_units(100, "km")- fill
The fill colour of the circles
- alpha
The transparency of the circles
- ...
Other arguments passed on to
ggplot2::geom_sf()
Value
A ggplot2 object
Examples
# load required packages
library(rnaturalearth)
library(sf)
#> Linking to GEOS 3.12.1, GDAL 3.8.4, PROJ 9.4.0; sf_use_s2() is TRUE
library(ggplot2)
s_america_sf <- ne_countries(continent = "South America", returnclass = "sf")
s_am_equal_area <- suggest_crs(s_america_sf, distortion = "equal_area")
#> To reduce overall distortion on the map, one can also compress the map in the north-south direction (with a factor s) and expand the map in the east-west direction (with a factor 1 / s). The factor s can be determined with a trial-and-error approach comparing the distortion patterns along the centre and at the border of the map.
ggplot(data = s_america_sf) +
  geom_sf() +
  geom_tissot() +
  coord_sf(crs = s_am_equal_area$proj4) +
  theme_minimal()