The functions areNeighbours, areConnected and the method
isConnected test connectivity in different ways.
Usage
areNeighbours(V1, V2, graph)

areConnected(x, nodes)

# S4 method for class 'gData'
isConnected(object, ...)

isReachable(x, loc)

connectivityPlot(x, ...)

# S4 method for class 'gGraph'
connectivityPlot(x, ..., seed = NULL)

# S4 method for class 'gData'
connectivityPlot(x, col.gGraph = 0, ..., seed = NULL)
Arguments
- V1
a vector of node names
- V2
a vector of node names
- graph
a valid graphNEL object.
- x
a valid gGraph object.
- nodes
a vector of node names
- object
a valid gData object.
- ...
other arguments passed to other methods.
- loc
location, specified as a list of two components giving respectively the longitude and the latitude. Alternatively, it can be a matrix-like object with one row and two columns.
- seed
an optional integer giving the seed to be used when randomizing colors. One given seed will always give the same set of colors. NULL by default, meaning colors are randomized each time a plot is drawn.
- col.gGraph
a character string or a number indicating the color of the nodes to be used when plotting the gGraph object. Defaults to '0', meaning that nodes are invisible.
Value
areNeighbours: a vector of logical, having one value for each couple of nodes.areConnected: a single logical value, being TRUE if nodes form a connected set.isConnected: a single logical value, being TRUE if nodes of the object form a connected set.
Details
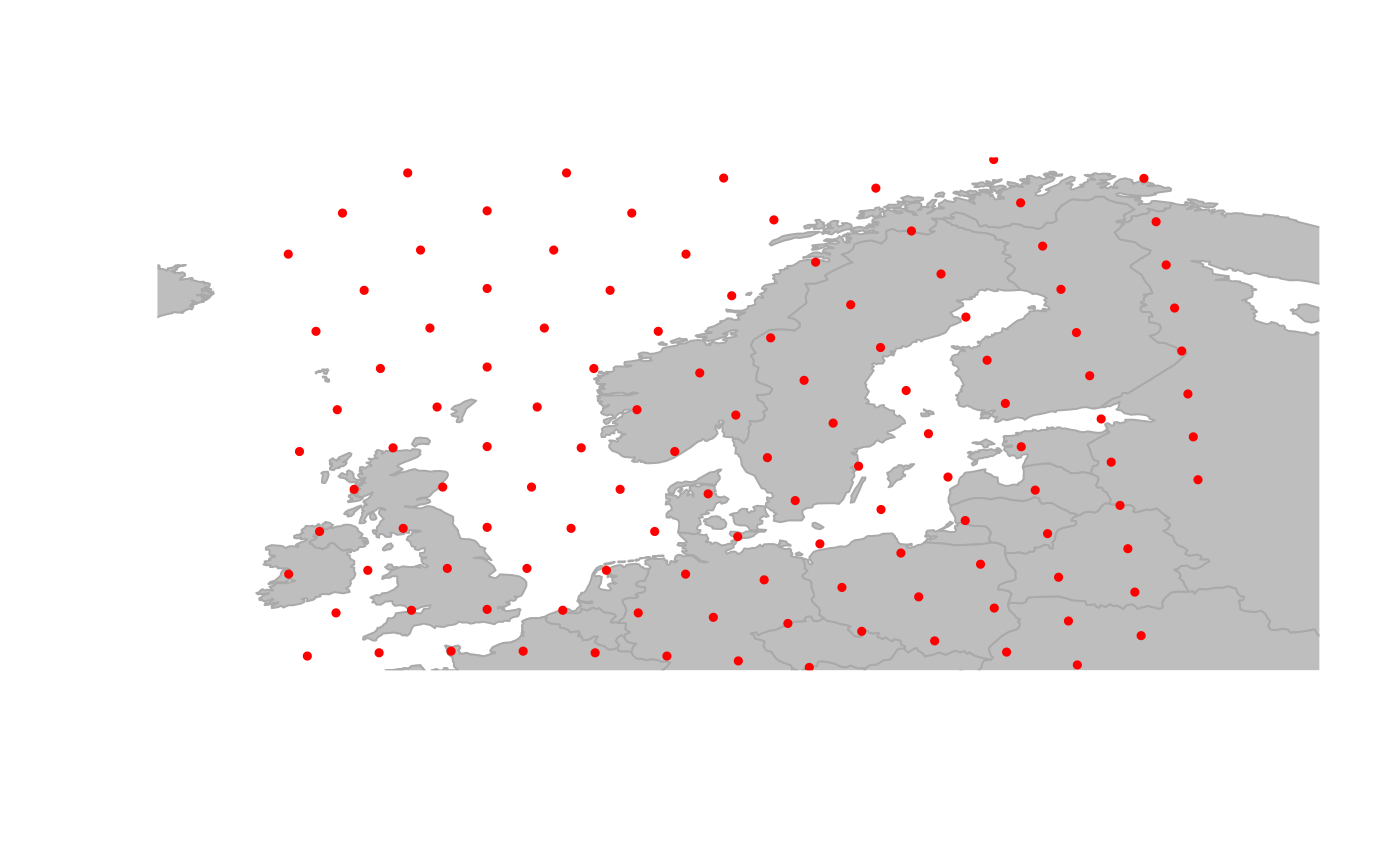
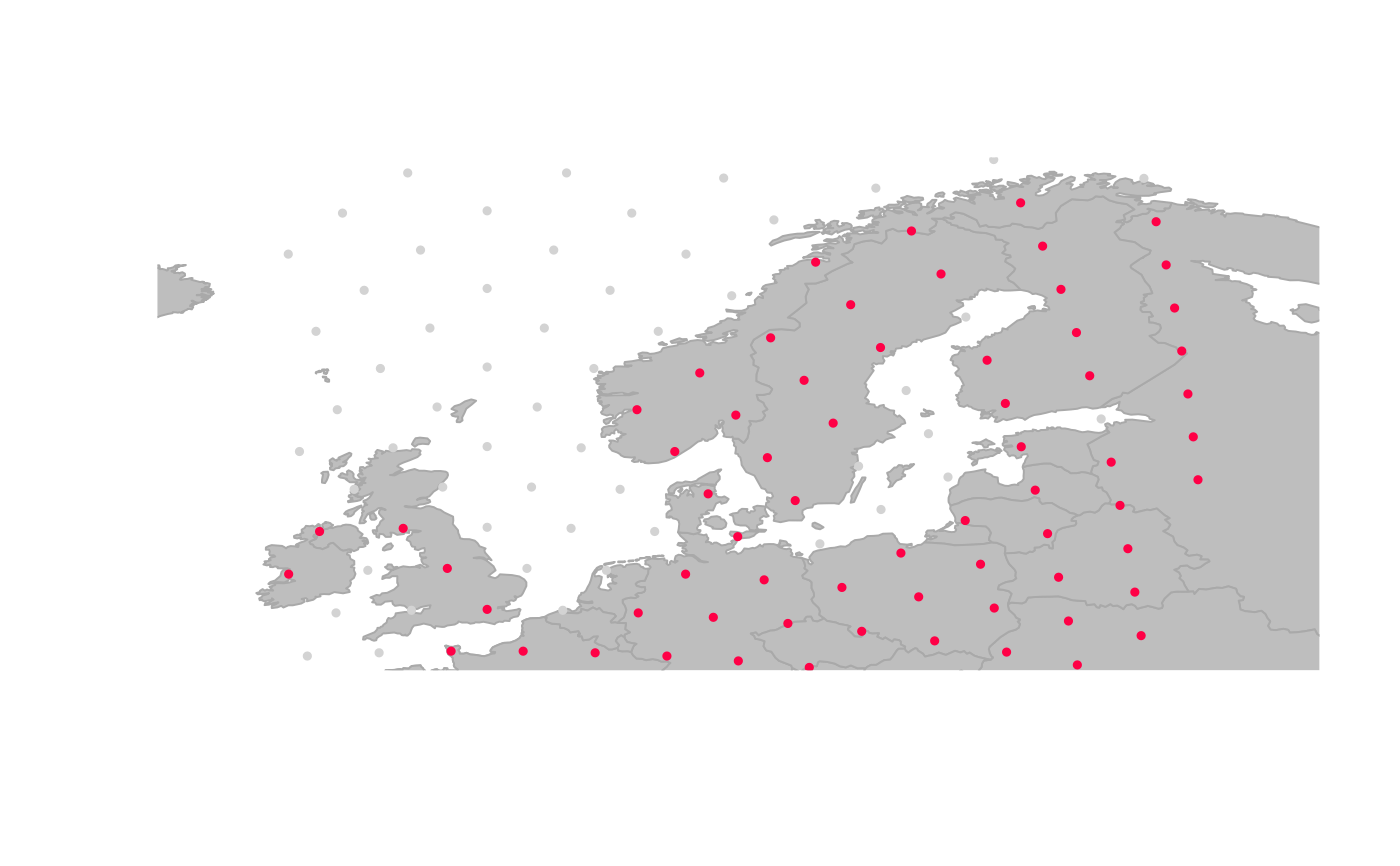
areNeighbours: tests connectivity between couples of nodes on an object inheritinggraphclass (like a graphNEL object).areConnected: tests if a set of nodes form a connected set on a gGraph object.isConnected: tests if the nodes of a gData object form a connected set. Note that this is a method for gData, the generic being defined in thegraphpackage.isReachable: tests if one location (actually, the closest node to it) is reachable from the set of nodes of a gData object.connectivityPlot: plots connected sets of a gGraph or a gData object with different colors.
In connectivityPlot, isolated nodes (i.e. belonging to no connected
set of size > 1) are plotted in light grey.