The functions geo.zoomin, geo.zoomout, geo.slide,
geo.back, geo.bookmark and geo.goto are used to
navigate interactively in the plot of a gGraph object.
Arguments
- reg
a list of length 2, with its first component being the new x (longitude) boundaries (a vector of length 2), and its second being new y (latitude) boundaries (a vector of length 2).
- vec
a numeric vector of length 4 giving the new coordinates of the plotting window, in the order: xmin, xmax, ymin, ymax.
- name
a character string giving the name of the bookmark to create (in
geo.bookmark) or to get back to (ingeo.goto).
Details
geo.zoomin and geo.zoomout are used to zoom in and out. For
zooming in, the user has to delimit the opposite corner of the new plotting
area; alternatively, a set of coordinates can be provided. For zooming out,
each click on the screen will zoom out further.
geo.slide moves the window toward the direction indicated by clicking
in the screen.
geo.back redraws previous plots each time screen is clicked.
geo.bookmark sets a bookmark for the current area. If the name for
the bookmark is left to NULL, then the list of currently available bookmarks
is returned.
geo.goto allows the user to get back to a bookmarked area.
.zoomlog.up is an auxiliary function used to update the zoom log, by
providing new sets of coordinates.
Whenever clicking is needed, a right-click will stop the function.
See also
plot.gGraph for plotting of a gGraph
object.
Examples
plot(worldgraph.10k, reset = TRUE)
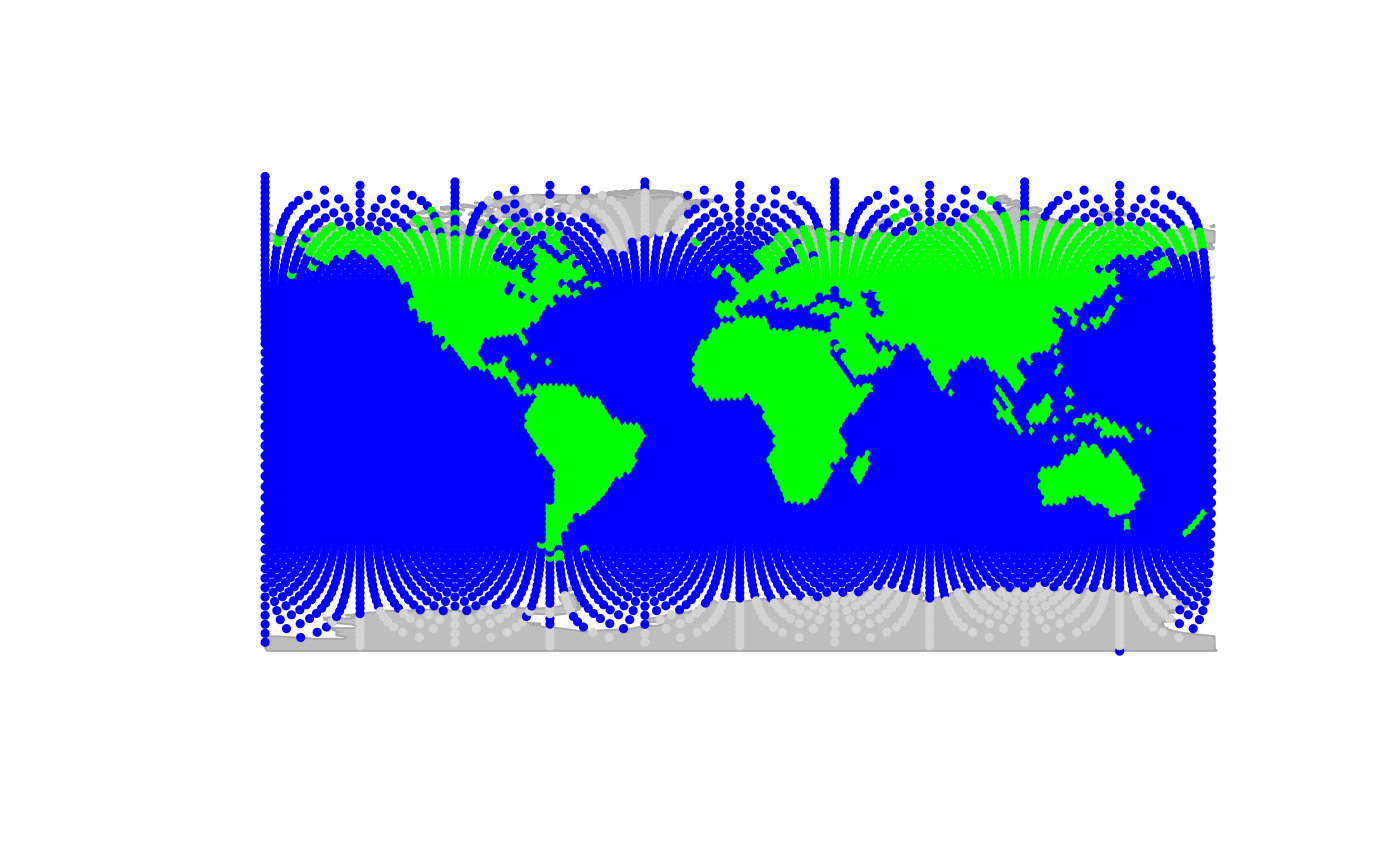 ## zooming in
x.ini <- c(-100, -60)
y.ini <- c(-30, 30)
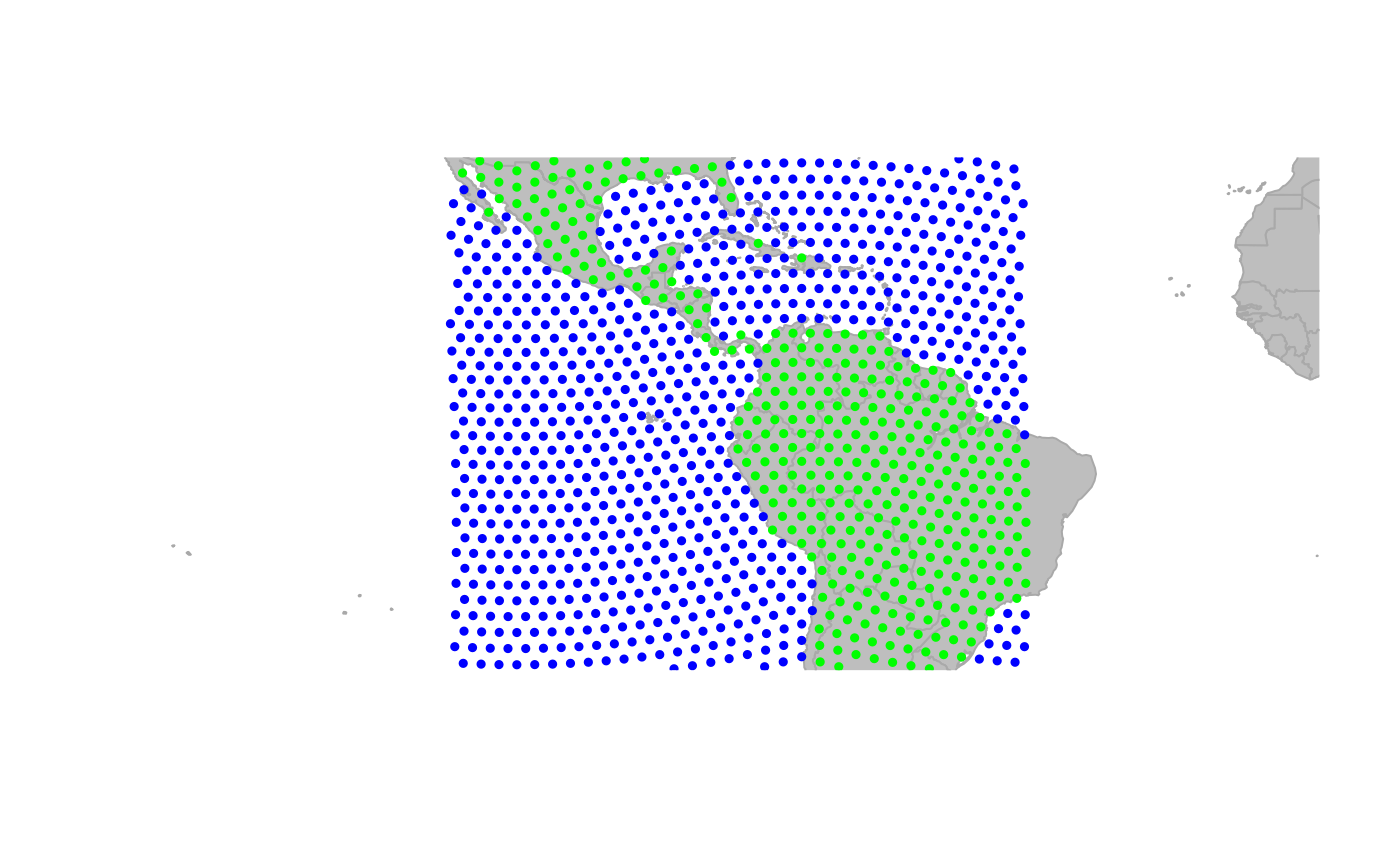
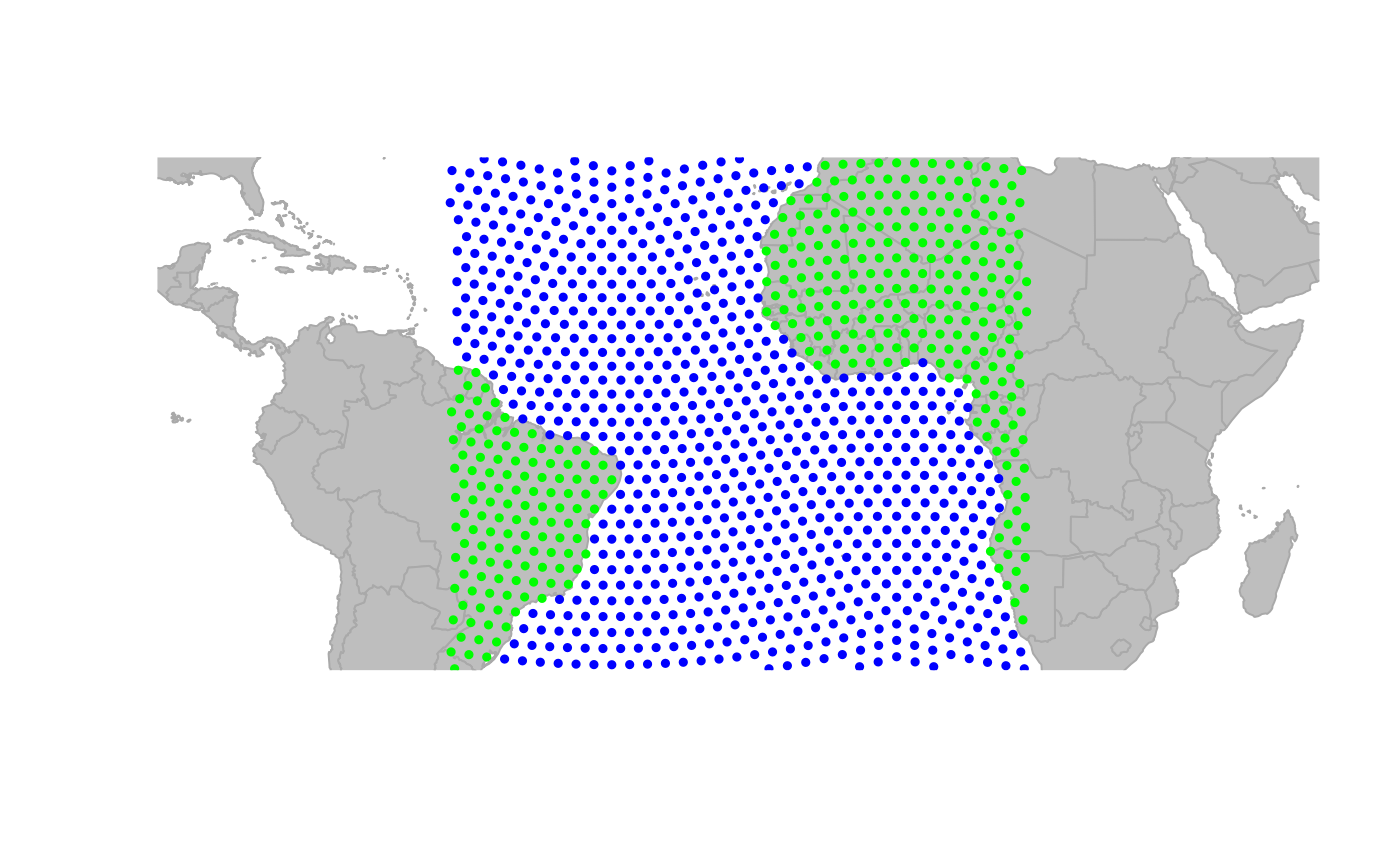
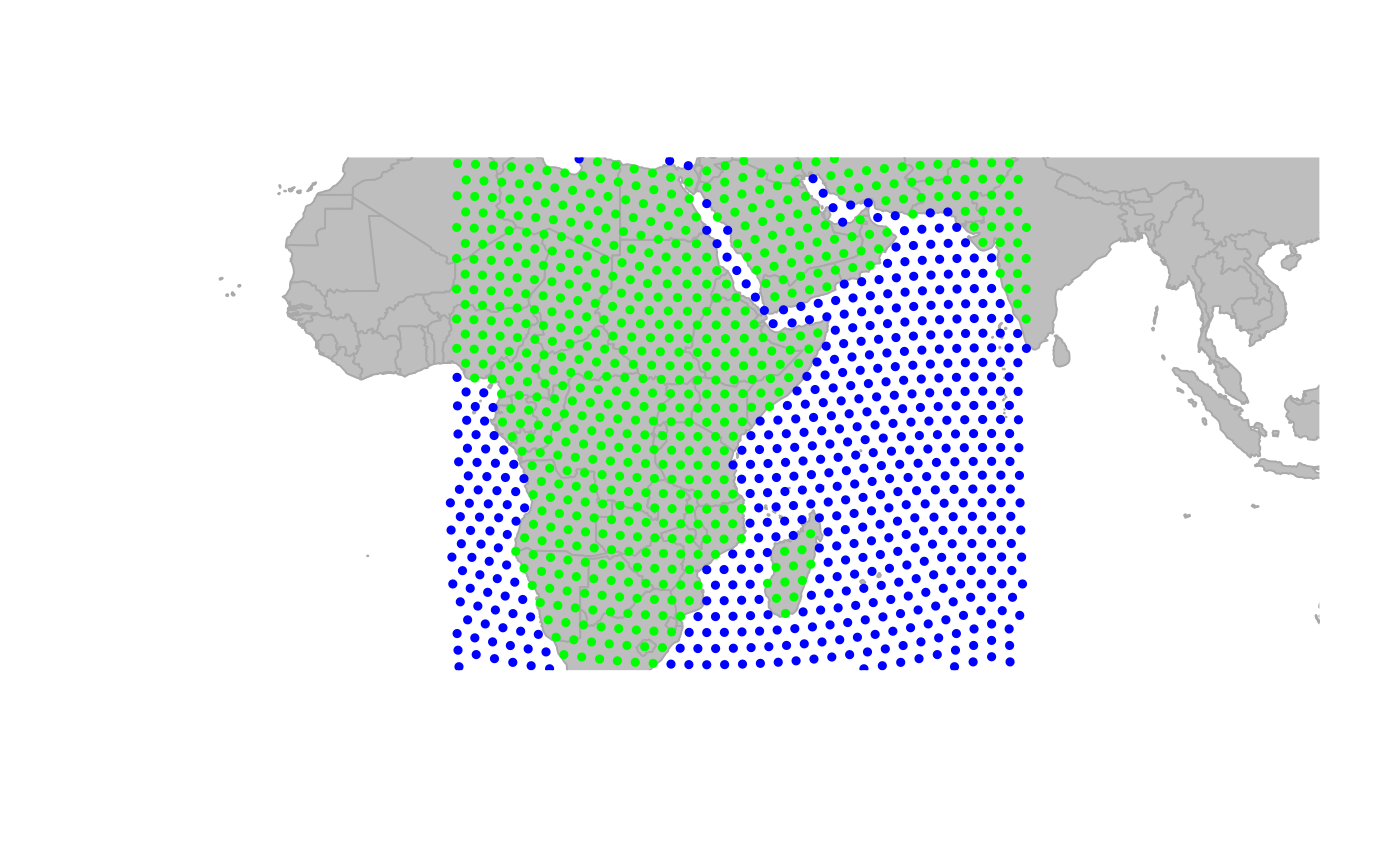
for (i in 0:3) {
geo.zoomin(list(x = x.ini + i * 60, y = y.ini))
}
## zooming in
x.ini <- c(-100, -60)
y.ini <- c(-30, 30)
for (i in 0:3) {
geo.zoomin(list(x = x.ini + i * 60, y = y.ini))
}
 if (FALSE) { # \dontrun{
## going back
geo.back() # you have to click !
## zooming in interactively
geo.zoomin() # you have to click !
## zooming out
geo.zoomout() # you have to click !
## moving window
geo.slide() # you have to click !
} # }
if (FALSE) { # \dontrun{
## going back
geo.back() # you have to click !
## zooming in interactively
geo.zoomin() # you have to click !
## zooming out
geo.zoomout() # you have to click !
## moving window
geo.slide() # you have to click !
} # }