Create a ggplot for a spatial initial rsplit.
Source:R/autoplot_spatial_initial_split.R
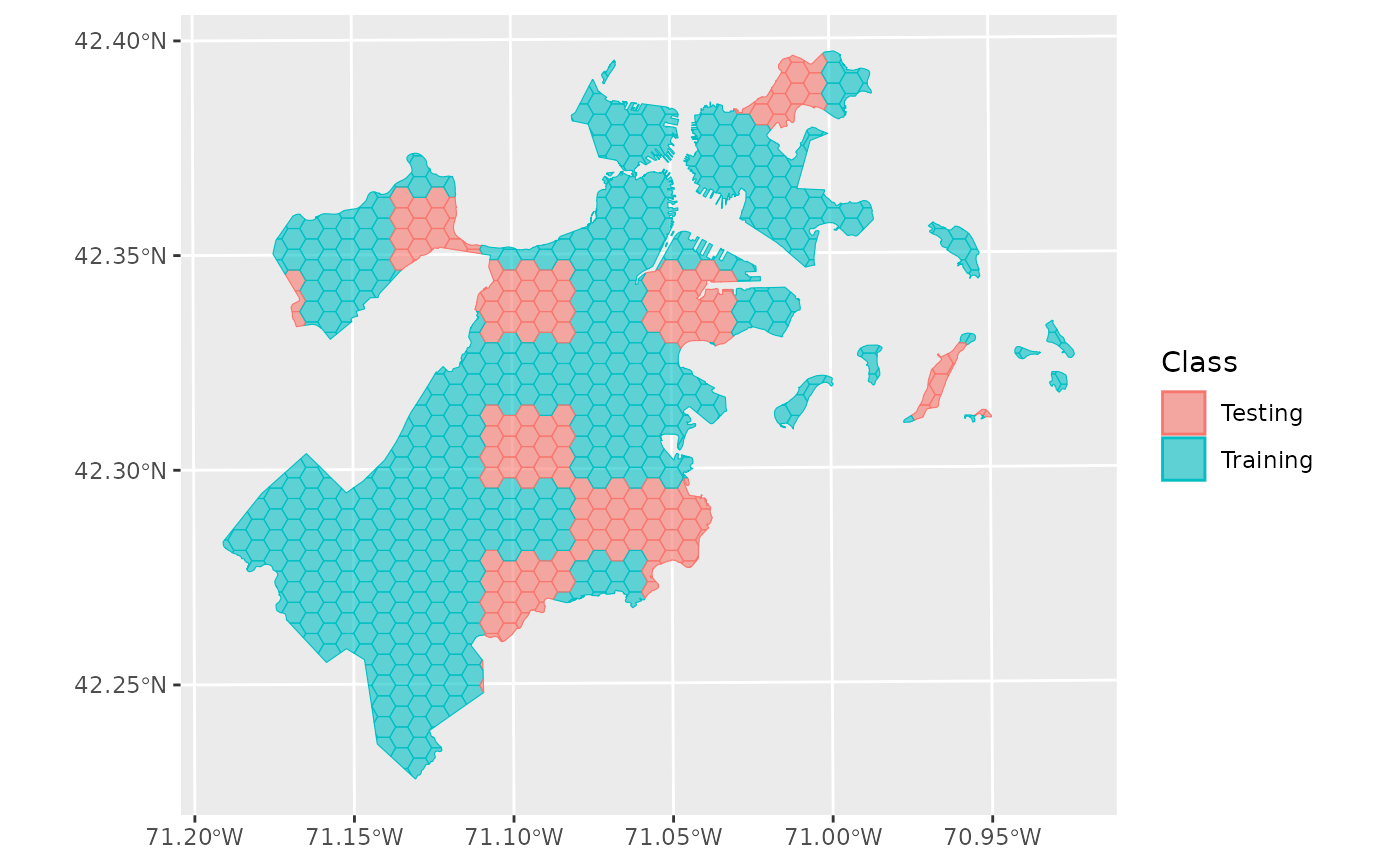
autoplot.spatial_initial_split.RdThis method provides a good visualization method for a spatial initial rsplit.
Arguments
- object
A
spatial_initial_rsplitobject. Note that only resamples made fromsfobjects createspatial_initial_rsplitobjects; this function will not work for resamples made with non-spatial tibbles or data.frames.- ...
Options passed to
ggplot2::geom_sf().- alpha
Opacity, passed to
ggplot2::geom_sf(). Values of alpha range from 0 to 1, with lower values corresponding to more transparent colors.
Value
A ggplot object with each fold assigned a color, made using
ggplot2::geom_sf().
Details
This plot method is a wrapper around the standard spatial_rsplit method,
but it re-labels the folds as Testing and Training following the
convention for a standard initial_split object
Examples
set.seed(123)
block_initial <- spatial_initial_split(boston_canopy,
  prop = 1 / 5, spatial_block_cv
)
autoplot(block_initial)