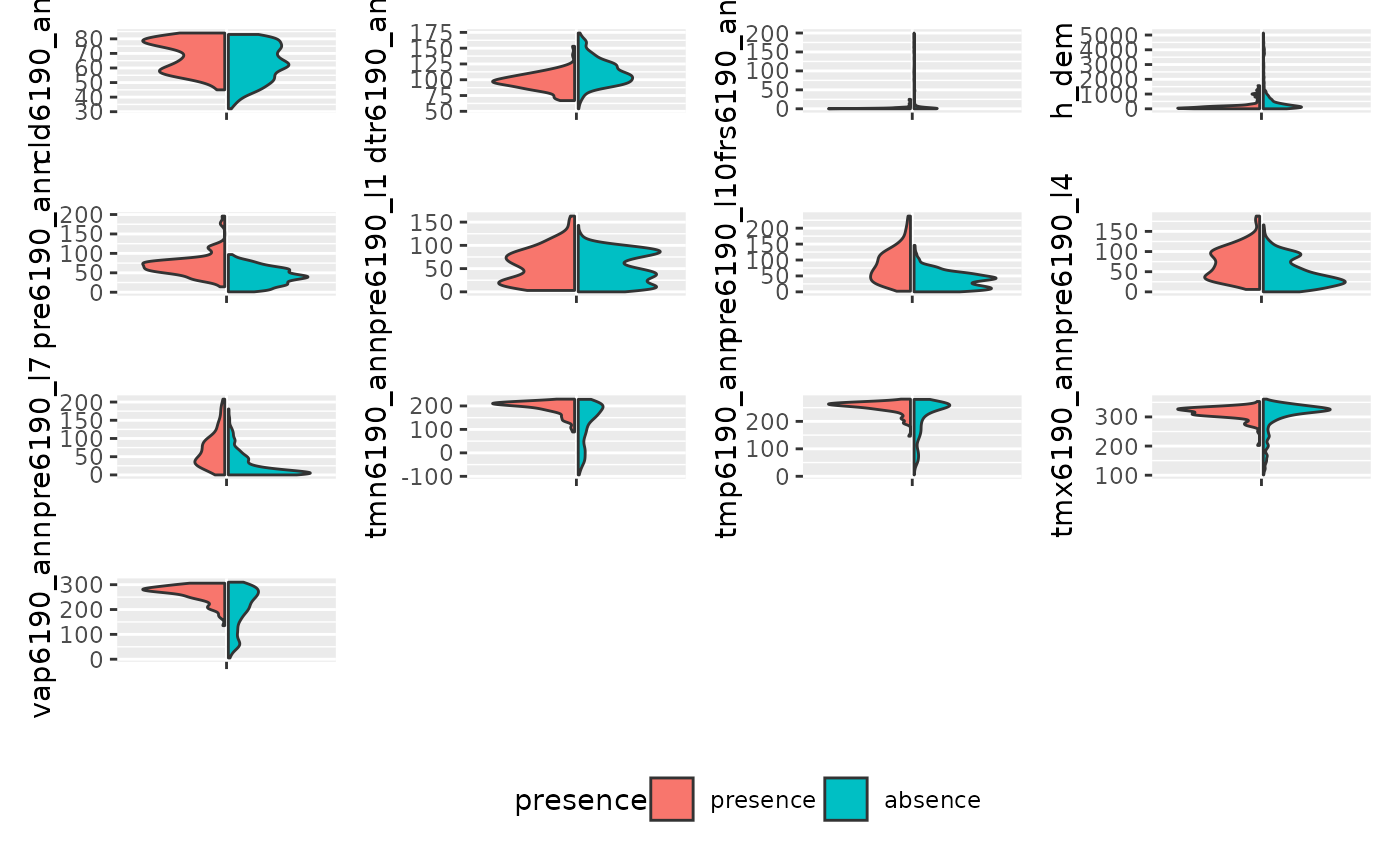
Create a composite plots contrasting the distribution of multiple variables for presences vs the background.
Arguments
- .data
a
data.frame(or derived object, such astibble::tibble, orsf::st_sf) with values for the bioclimate variables for presences and background- .col
the column containing the presences; it assumes presences to be the first level of this factor