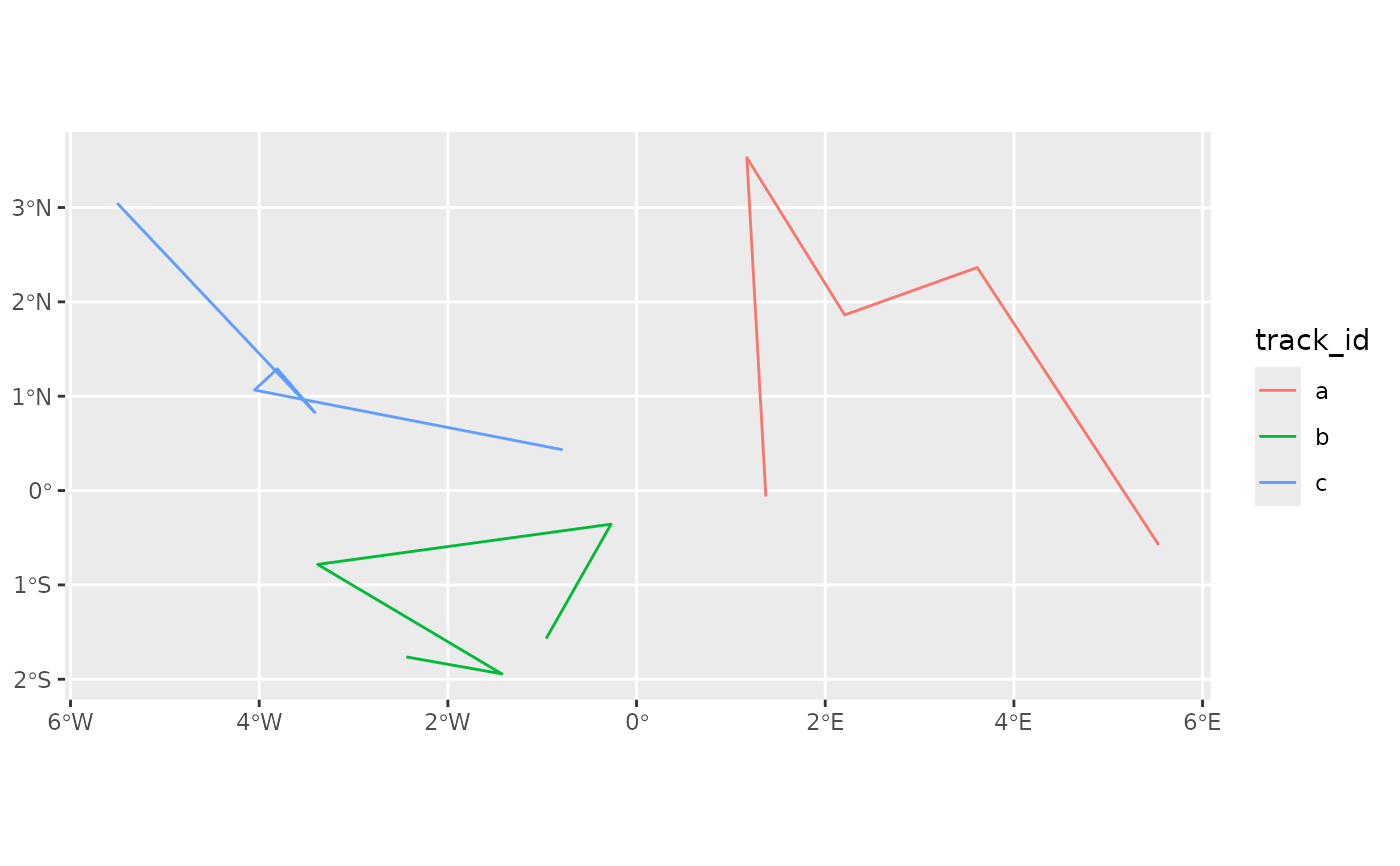
This function provides a ggplot2 geometry to plot track as
paths. It uses track_lines() to create sf multilines which are then
plotted via a wrapper around [ggplot2::geom_sf()], thus allowing for
projections to be set using the ggplot2::coord_sf()` function. See
ggplot2::geom_sf() for details. All variables from the metadata table can
be used for mapping.
Usage
geom_track_path(
  mapping = ggplot2::aes(),
  data = NULL,
  stat = "sf",
  position = "identity",
  na.rm = FALSE,
  show.legend = NA,
  ...
)
Arguments
- mapping
Set of aesthetic mappings created by
ggplot2::aes(). Variables from the metadata table can be used for mapping. If none is provided a basic aesthetics for thesfstep segments (i.e. multilines) will be used, as it is the case forggplot2::geom_sf().- data
The
move2object to be displayed. For this geometry, there is no inheritance from the mainggplot()call, and data has to be specified.- stat
The statistical transformation to use on the data for this layer. The default is "sf", which should normally be left unchanged.
- position
The position adjustment to use for overlapping points on this layer. The default is "identity", meaning no adjustment will be made to the data.
- na.rm
If FALSE, the default, missing values are removed with a warning. If TRUE, missing values are silently removed.
- show.legend
logical. Should this layer be included in the legends? The default is NA, which includes if any aesthetics are mapped. It can also be a named logical vector to finely select the aesthetics to display.
- ...
Other arguments passed on to
ggplot2::layer().