The generic function isInArea finds which nodes fall in a given area.
Nodes can be specified in different ways, including by providing a
gGraph or a gData object. Different formats for the output are
also available. The area can be defined interactively (current plot
window), from the zoom log, or explicitly by providing a bounding box.
Usage
isInArea(x, ...)

# S4 method for class 'matrix'
isInArea(
  x,
  reg = "current",
  res.type = c("logical", "integer", "character"),
  buffer = 0,
  quiet = FALSE
)

# S4 method for class 'data.frame'
isInArea(
  x,
  reg = "current",
  res.type = c("logical", "integer", "character"),
  buffer = 0,
  quiet = FALSE
)

# S4 method for class 'gGraph'
isInArea(
  x,
  reg = "current",
  res.type = c("logical", "integer", "character"),
  buffer = 0,
  quiet = FALSE
)

# S4 method for class 'gData'
isInArea(
  x,
  reg = "current",
  res.type = c("logical", "integer", "character"),
  buffer = 0,
  quiet = FALSE
)
Arguments
- x
a matrix,
data.frame, validgGraph, or validgDataobject. For matrix and data.frame, input must have two columns giving longitudes and latitudes of locations being considered.- ...
further arguments passed to specific methods.
- reg
a character string or a list indicating the area. Character strings can be
"current"(current user window, default) or"zoom"(current zoom). If a list, it must have two components, both being numeric vectors of length two, giving x and y limits of the area, e.g.list(x = c(-10, 30), y = c(35, 70)). A list produced bylocator()is also a valid value.- res.type
a character string indicating what kind of output should be produced. See value.
- buffer
a numeric value giving a buffer adding extra space around the area, as a proportion of current area's dimensions.
- quiet
logical. If
TRUE, suppresses printing of bounding box coordinates and a reproducibleregargument that can be copy-pasted into scripts for exact reproducibility. Defaults toFALSE.
Value
The output depends on the value of the argument res.type:
"logical": a vector of logicals having one value for each node."integer": a vector of integers corresponding to the indices of nodes falling within the area."character": a vector of characters corresponding to the names of the nodes falling within the area.
Functions
isInArea(matrix): Method for matrixisInArea(data.frame): Method for data.frameisInArea(gGraph): Method for gGraph objectisInArea(gData): Method for gData object
See also
geo.zoomin to zoom into an area. gGraph and
gData for the input object classes.
Examples
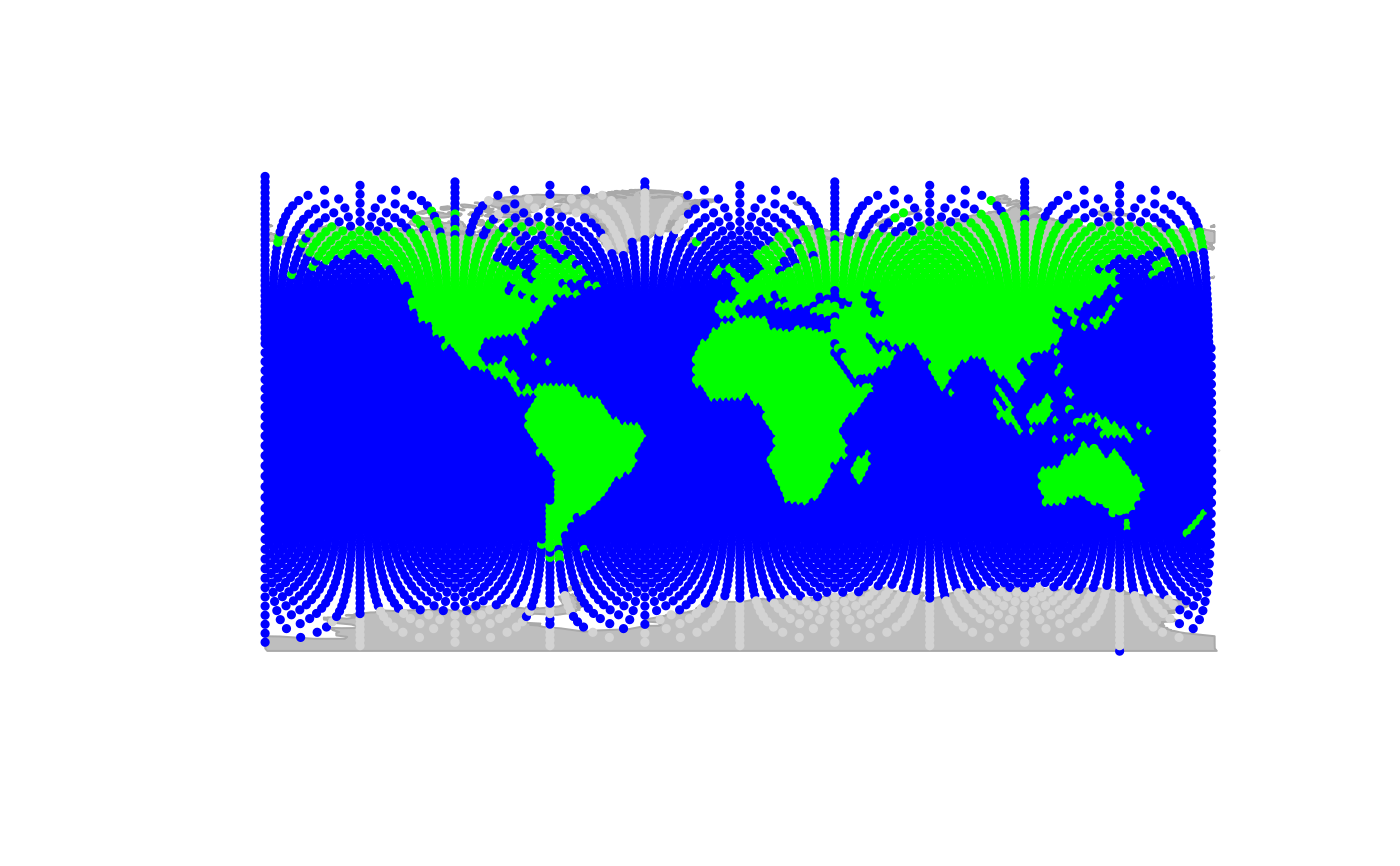
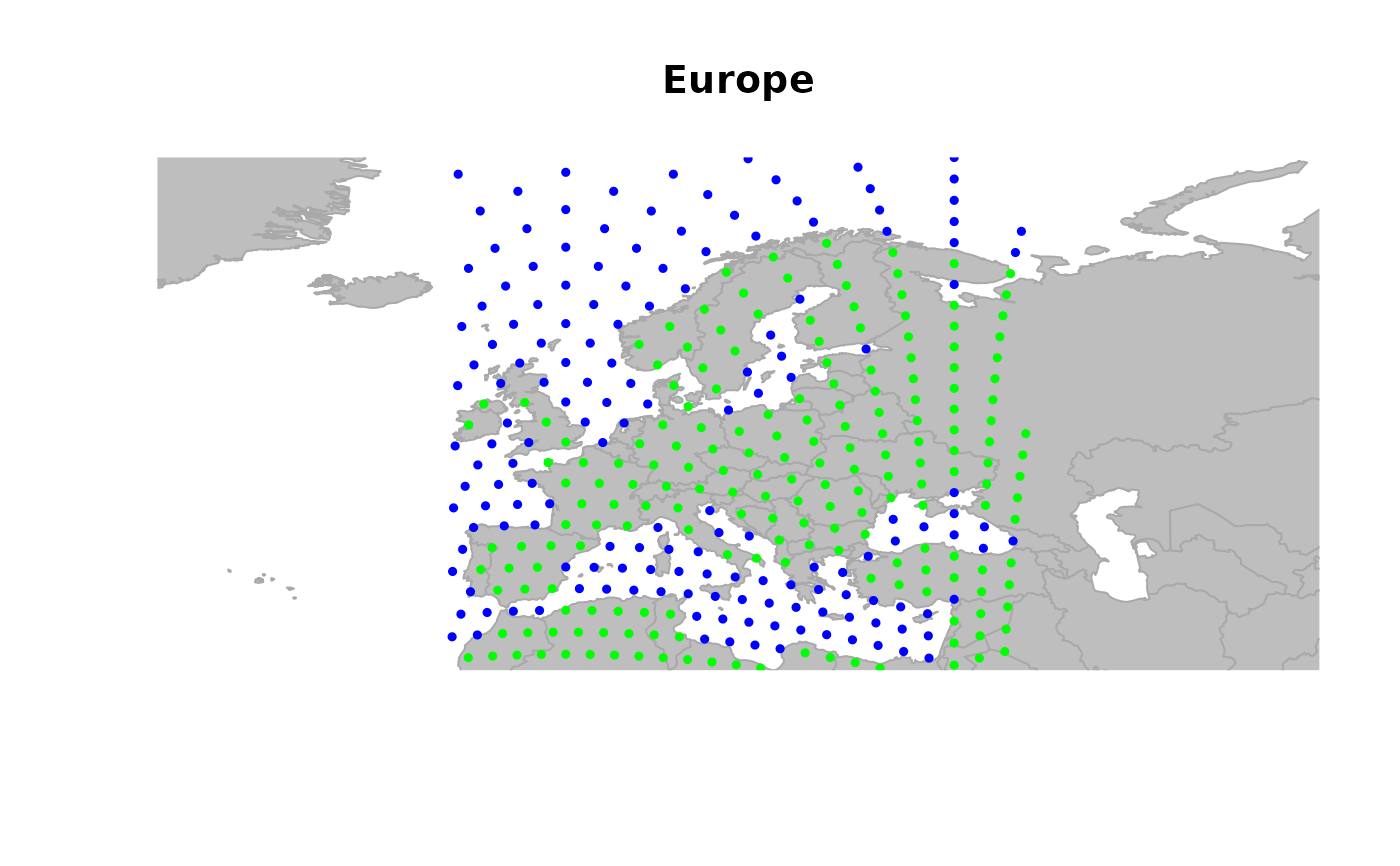
## Zoom into Europe and get the nodes in the current plot
plot(worldgraph.10k, reset = TRUE)
#> Spherical geometry (s2) switched off
 #> Spherical geometry (s2) switched on
geo.zoomin(list(x = c(-6, 38), y = c(35, 73)))
#> Spherical geometry (s2) switched off
#> Spherical geometry (s2) switched on
geo.zoomin(list(x = c(-6, 38), y = c(35, 73)))
#> Spherical geometry (s2) switched off
 #> Spherical geometry (s2) switched on
## Different output formats of the current nodes
head(isInArea(worldgraph.10k, quiet = TRUE))
#> 1 2 3 4 5 6
#> FALSE FALSE FALSE FALSE FALSE FALSE
head(isInArea(worldgraph.10k, res.type = "integer", quiet = TRUE))
#> 707 965 1027 1028 1029 1285
#> 707 965 1027 1028 1029 1285
head(isInArea(worldgraph.10k, res.type = "character", quiet = TRUE))
#> [1] "707" "965" "1027" "1028" "1029" "1285"
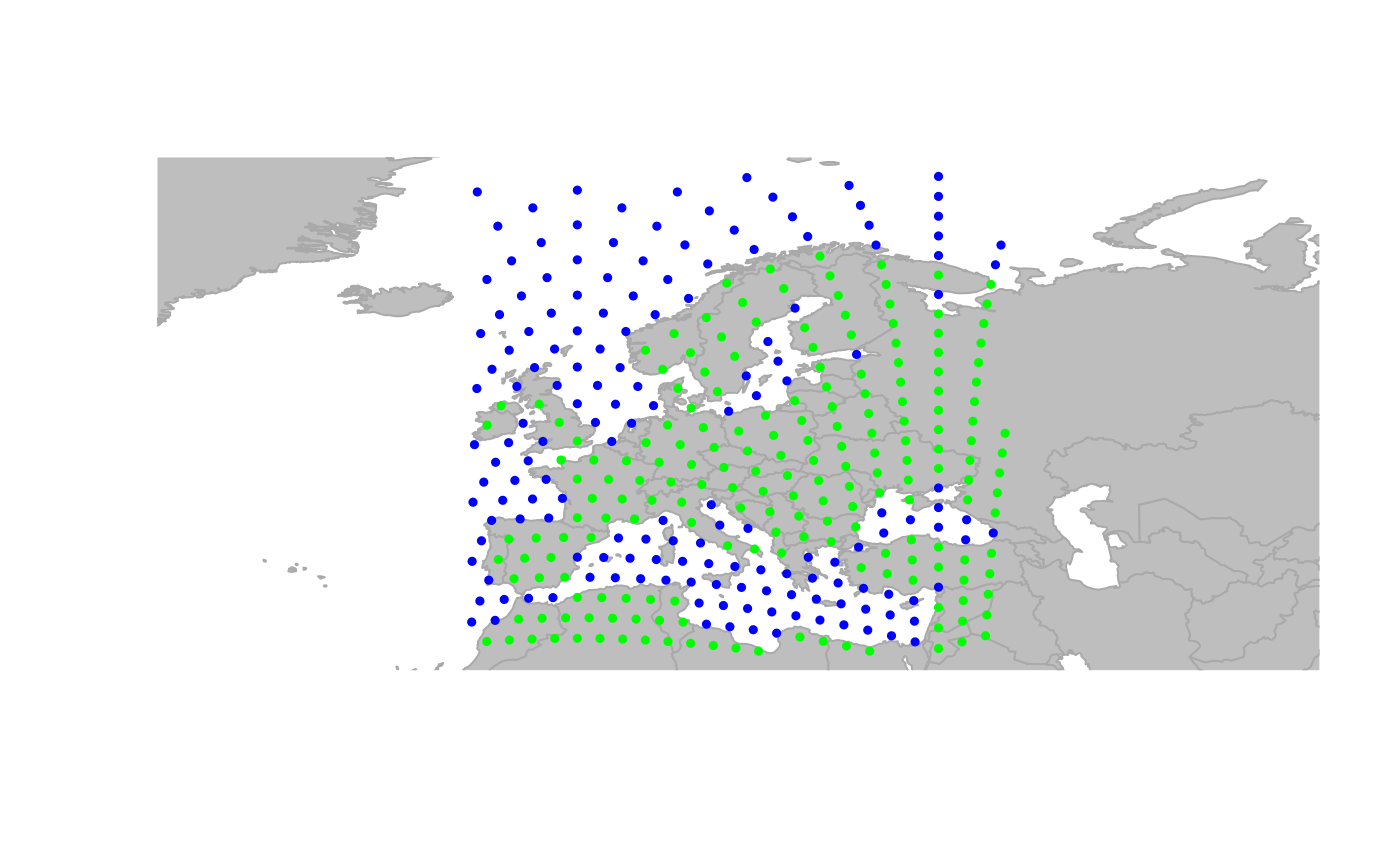
## subset the gGraph just to visible nodes
x <- worldgraph.10k[isInArea(worldgraph.10k)]
#> Area: lon = [-29.4479, 61.4479], lat = [30.2400, 77.7600]
#>
#> Reproducible call: reg = list(x = c(-29.4479, 61.4479), y = c(30.2400, 77.7600))
plot(x, reset = TRUE)
#> Spherical geometry (s2) switched off
#> Spherical geometry (s2) switched on
## Different output formats of the current nodes
head(isInArea(worldgraph.10k, quiet = TRUE))
#> 1 2 3 4 5 6
#> FALSE FALSE FALSE FALSE FALSE FALSE
head(isInArea(worldgraph.10k, res.type = "integer", quiet = TRUE))
#> 707 965 1027 1028 1029 1285
#> 707 965 1027 1028 1029 1285
head(isInArea(worldgraph.10k, res.type = "character", quiet = TRUE))
#> [1] "707" "965" "1027" "1028" "1029" "1285"
## subset the gGraph just to visible nodes
x <- worldgraph.10k[isInArea(worldgraph.10k)]
#> Area: lon = [-29.4479, 61.4479], lat = [30.2400, 77.7600]
#>
#> Reproducible call: reg = list(x = c(-29.4479, 61.4479), y = c(30.2400, 77.7600))
plot(x, reset = TRUE)
#> Spherical geometry (s2) switched off
 #> Spherical geometry (s2) switched on
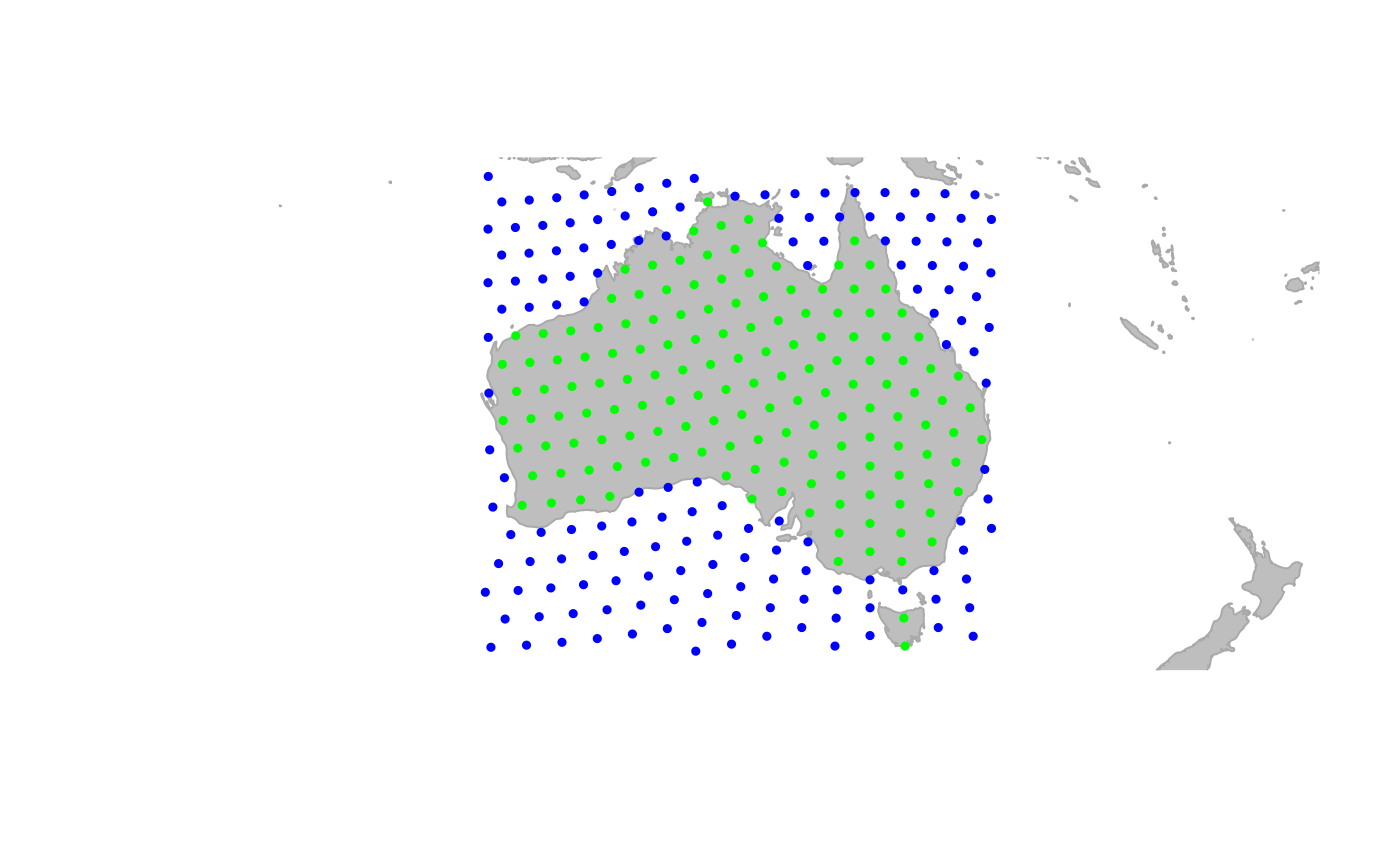
## Instead of the current plotted area we can use an explicit bounding box
y <- worldgraph.10k[(isInArea(worldgraph.10k,
reg = list(x = c(113, 154), y = c(-44, -10)),
quiet = TRUE
))]
plot(y, reset = TRUE)
#> Spherical geometry (s2) switched off
#> Spherical geometry (s2) switched on
## Instead of the current plotted area we can use an explicit bounding box
y <- worldgraph.10k[(isInArea(worldgraph.10k,
reg = list(x = c(113, 154), y = c(-44, -10)),
quiet = TRUE
))]
plot(y, reset = TRUE)
#> Spherical geometry (s2) switched off
 #> Spherical geometry (s2) switched on