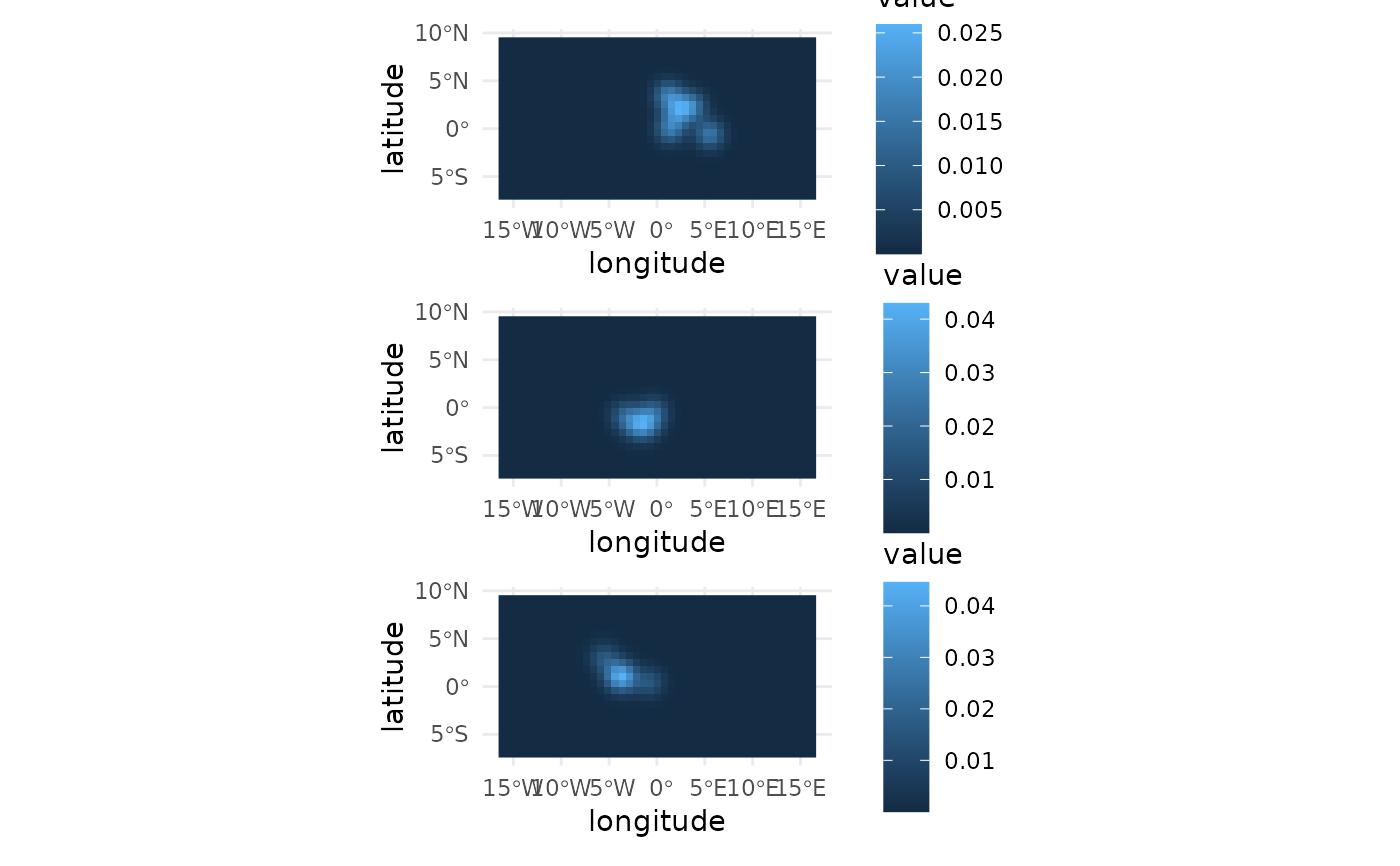
Autoplot a tibble of utilisation distributions
Source:R/autoplot_hr_ud_tbl.R
autoplot.hr_tt_ud_tbl.RdThis autoplot function can be used to plot all or a subset of UDs from a
tibble of UDs created by hr_tt_kde(). The first column of the tibble is
assumed to be an id column, which is used to identify the UDs to plot. The
layout of the plots can be specified with the layout argument, and it is
assembled with patchwork.
Usage
# S3 method for class 'hr_tt_ud_tbl'
autoplot(object, id_to_plot = NULL, layout = NULL, ...)
Arguments
- object
A tibble of utilisation distributions created by kde of class
hr_tt_ud_tblas created withhr_tt_kde().- id_to_plot
Integer or character, the id of the utilisation distribution to plot. If
NULL, all utilisation distributions in the tibble are plotted. The first column of the tibble is assumed to be the id column.- layout
A vector of length 2, the number of rows and columns in the plot layout. If
NULL, the layout is determined automatically.- ...
Not used.
Value
A patchwork plot object created with patchwork::wrap_plots(). When
one utilisation distribution is selected, the result is a single-panel
plot composition; when multiple utilisation distributions are selected,
the result is a multi-panel plot composition.