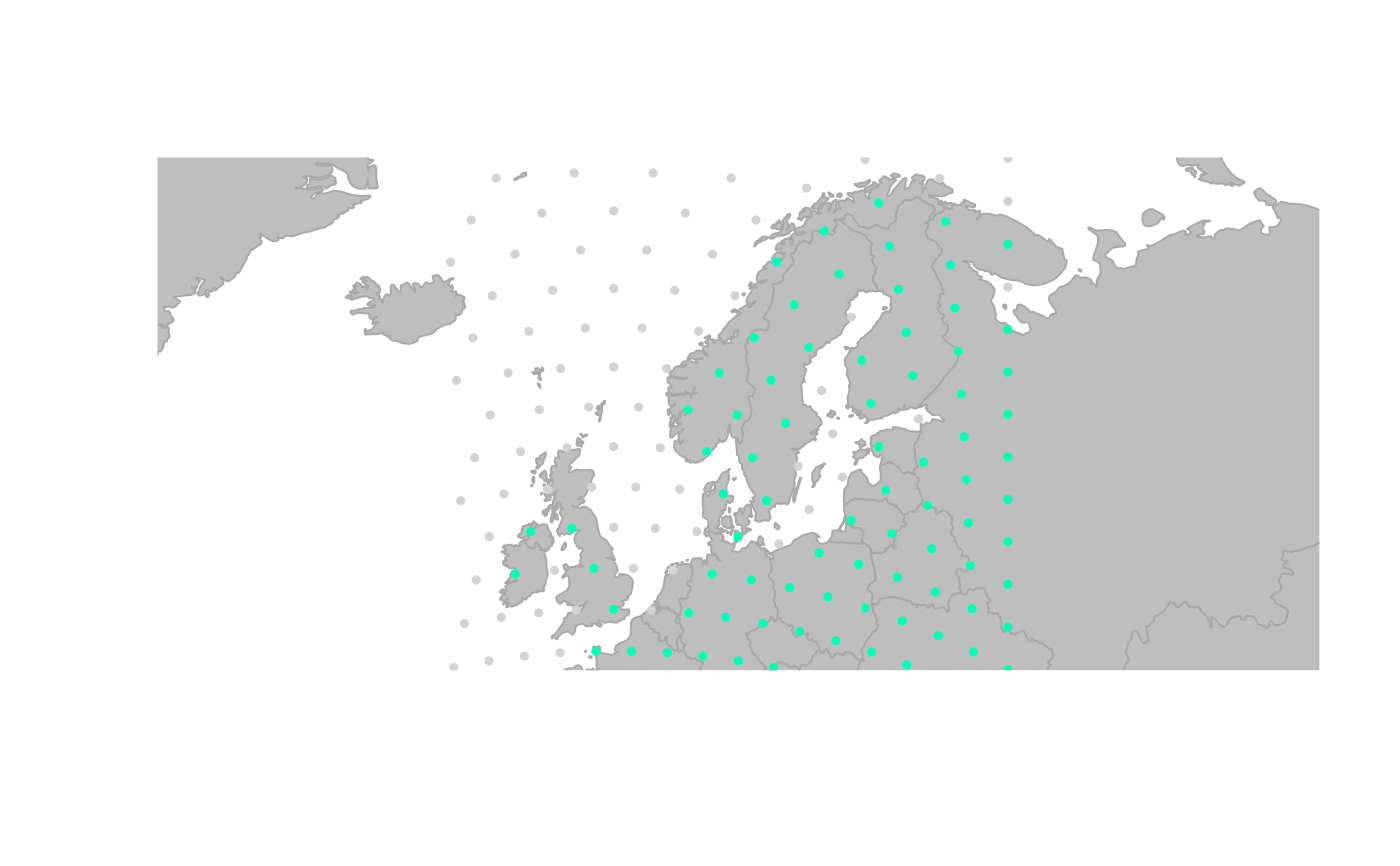
The function connectivityPlot plots the connected sets of a gGraph or
gData object with different colors. Isolated nodes (i.e. belonging to
no connected set of size > 1) are plotted in light gray.
Usage
connectivityPlot(x, ...)

# S4 method for class 'gGraph'
connectivityPlot(x, ..., seed = NULL)

# S4 method for class 'gData'
connectivityPlot(x, ..., seed = NULL)Functions
connectivityPlot(gGraph): Method for gGraph objectsconnectivityPlot(gData): Method for gData objects
Examples
# plot connected sets of a gGraph object
connectivityPlot(worldgraph.10k)
#> Spherical geometry (s2) switched off
 #> Spherical geometry (s2) switched on
# plot connected sets of a gData object
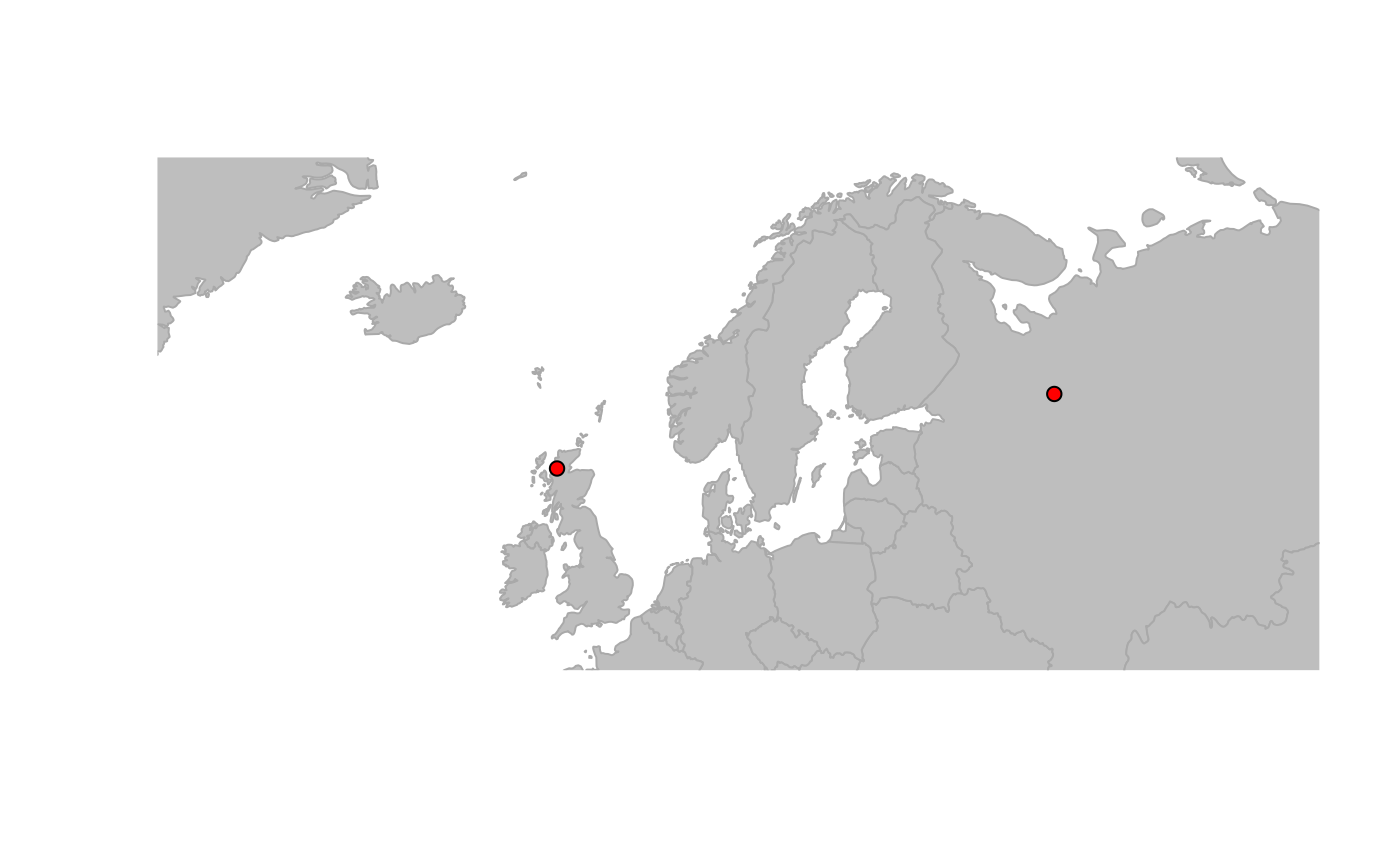
connectivityPlot(hgdp)
#> Spherical geometry (s2) switched off
#> Spherical geometry (s2) switched on
#> Spherical geometry (s2) switched on
# plot connected sets of a gData object
connectivityPlot(hgdp)
#> Spherical geometry (s2) switched off
#> Spherical geometry (s2) switched on