This autoplot will automatically rearrange individuals according to their id
and any grouping variables if an associated 'data' gen_tibble is provided. To
avoid any automatic re-sorting of individuals, set arrange_by_group and
arrange_by_indiv to FALSE.
Usage
# S3 method for class 'q_matrix'
autoplot(
  object,
  data = NULL,
  annotate_group = TRUE,
  arrange_by_group = TRUE,
  arrange_by_indiv = TRUE,
  reorder_within_groups = FALSE,
  ...
)
Arguments
- object
A Q matrix object (as returned by
q_matrix()).- data
An associated tibble (e.g. a
gen_tibble), with the individuals in the same order as the data used to generate the Q matrix- annotate_group
Boolean determining whether to annotate the plot with the group information
- arrange_by_group
Boolean determining whether to arrange the individuals by group. If the grouping variable in the
gen_tibbleor the metadata of thegt_admixtobject is a factor, the data will be ordered by the levels of the factor; else it will be ordered alphabetically.- arrange_by_indiv
Boolean determining whether to arrange the individuals by their individual id (if arrange_by_group is TRUE, they will be arranged by group first and then by individual id, i.e. within each group). If
idin theget_tibbleor the metadata of thegt_admixobject is a factor, it will be ordered by the levels of the factor; else it will be ordered alphabetically.- reorder_within_groups
Boolean determining whether to reorder the individuals within each group based on their ancestry proportion (note that this is not advised if you are making multiple plots, as you would get a different order for each plot!). If TRUE,
annotate_groupmust also be TRUE.- ...
not currently used.
Examples
# Read example gt_admix obejct
admix_obj <-
readRDS(system.file("extdata", "anolis", "anole_adm_k3.rds",
package = "tidypopgen"
))
# Extract a Q matrix
q_mat_k3 <- get_q_matrix(admix_obj, k = 3, run = 1)
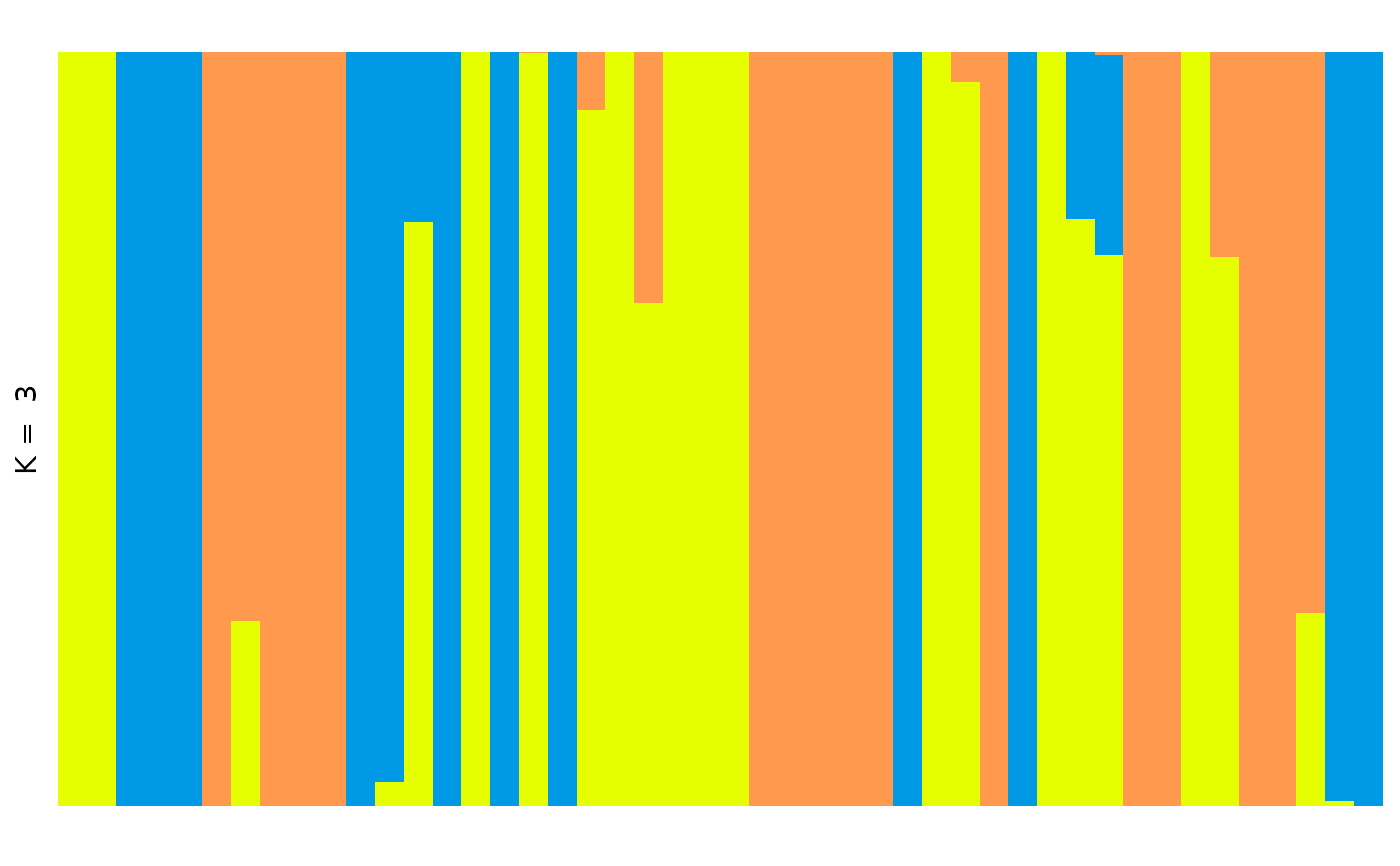
# Basic autoplot
autoplot(q_mat_k3, annotate_group = FALSE, arrange_by_group = FALSE)
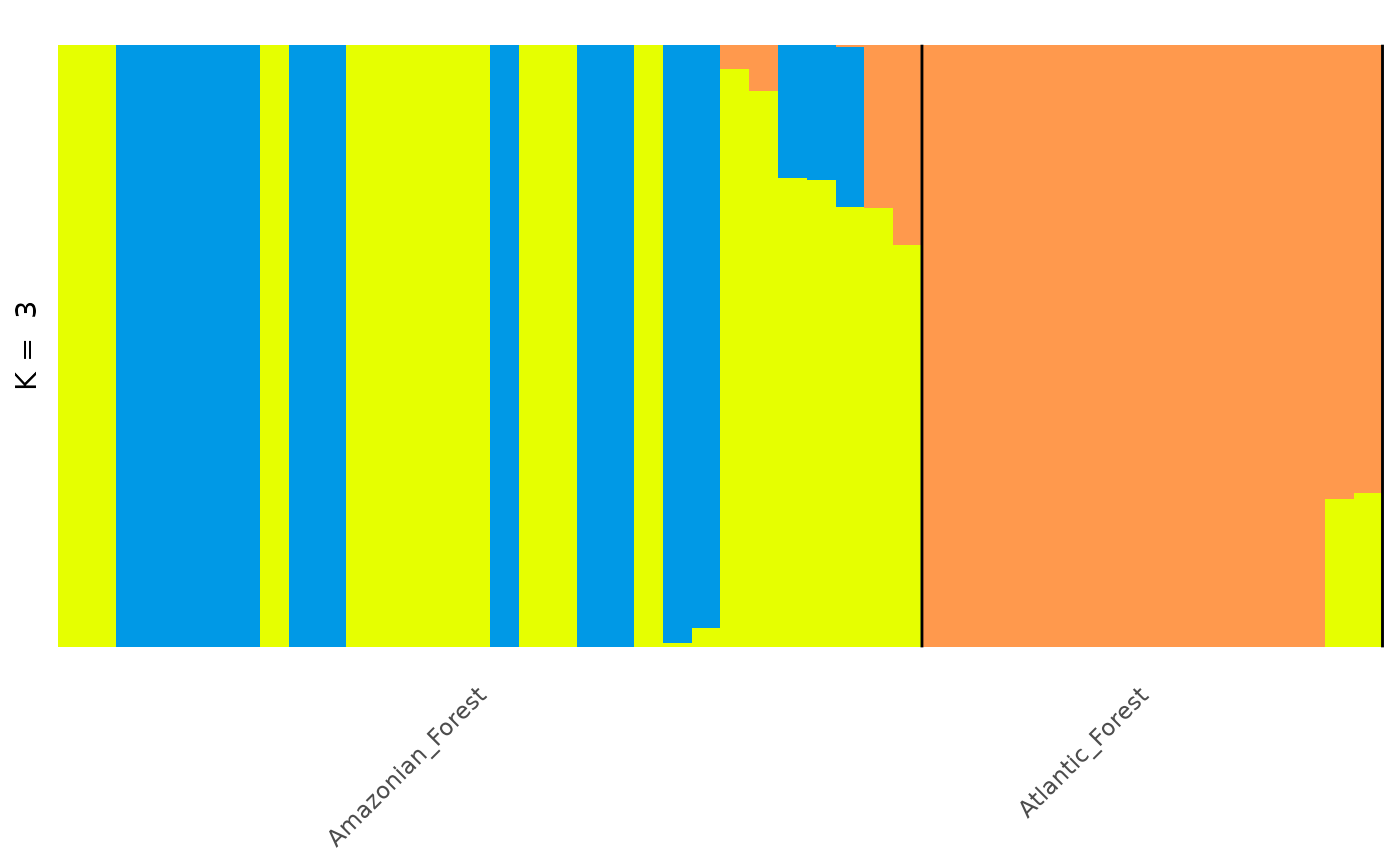
 # To arrange individuals by group and by Q proportion
autoplot(q_mat_k3,
annotate_group = TRUE, arrange_by_group = TRUE,
arrange_by_indiv = TRUE, reorder_within_groups = TRUE
)
# To arrange individuals by group and by Q proportion
autoplot(q_mat_k3,
annotate_group = TRUE, arrange_by_group = TRUE,
arrange_by_indiv = TRUE, reorder_within_groups = TRUE
)