The function makeSquareGrid builds a gGraph using a regular square grid for a given area.
If no area is specified, currently plotted area is used. Note that such grid is only valid for
small scales, for cases in which curvature of the surface of the earth can be neglected.
Arguments
- size
an integer giving the approximate number of nodes of the grid. The function will attempt to make a square grid of (approximately) this size.
- n.lon
the number of longitude coordinates of the grid (i.e., width of the grid, in number of cells)
- n.lat
the number of latitude coordinates of the grid (i.e., height of the grid, in number of cells)
- lon.range, lat.range
vectors of length two giving the range covered by the grid, in longitude and latitude, respectively.
Value
A gGraph object.
See also
makeHexGrid for a hexagonal grid that avoids projection
distortions over large areas. findLand to classify nodes as land
or sea after creating the grid.
Examples
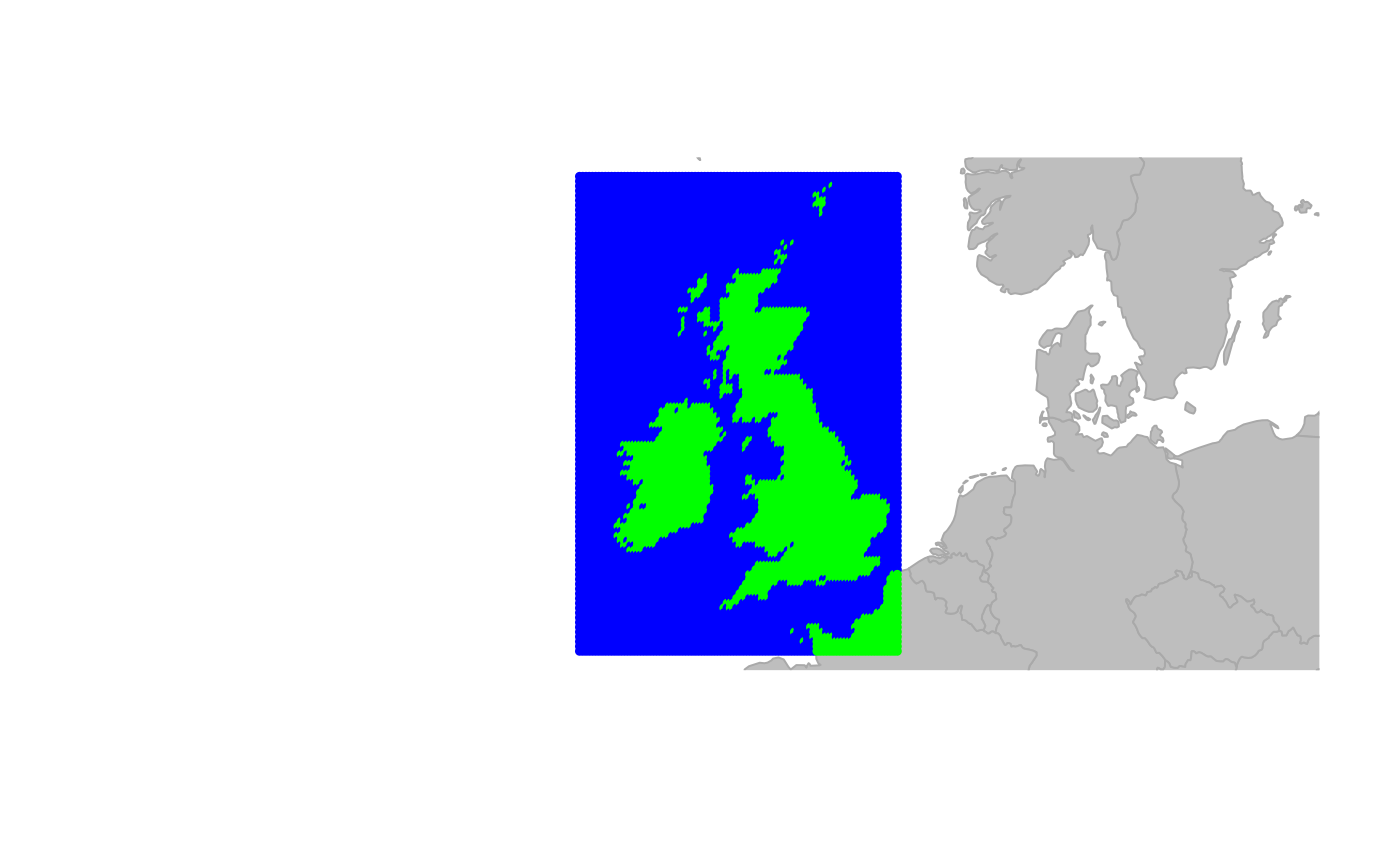
# by defining the range covered by the grid
squareGraph <- makeSquareGrid(
size = 10000,
lon.range = c(-12, 2),
lat.range = c(49, 61)
)
squareGraph <- findLand(squareGraph)
#> Spherical geometry (s2) switched off
#> although coordinates are longitude/latitude, st_intersects assumes that they
#> are planar
#> Spherical geometry (s2) switched on
squareGraph <- setColors(
squareGraph,
col.rules = data.frame(
habitat = c("sea", "land"),
color = c("blue", "green")
)
)
plot(squareGraph, reset = TRUE)
#> Spherical geometry (s2) switched off
 #> Spherical geometry (s2) switched on
# If no area is specified, currently plotted area is used
geo.zoomin(c(8, 13, 54, 58))
#> Error in h(simpleError(msg, call)): error in evaluating the argument 'x' in selecting a method for function 'plot': object 'squareGraph' not found
newGraph <- makeSquareGrid(1e3)
newGraph <- findLand(newGraph)
#> Spherical geometry (s2) switched off
#> although coordinates are longitude/latitude, st_intersects assumes that they
#> are planar
#> Spherical geometry (s2) switched on
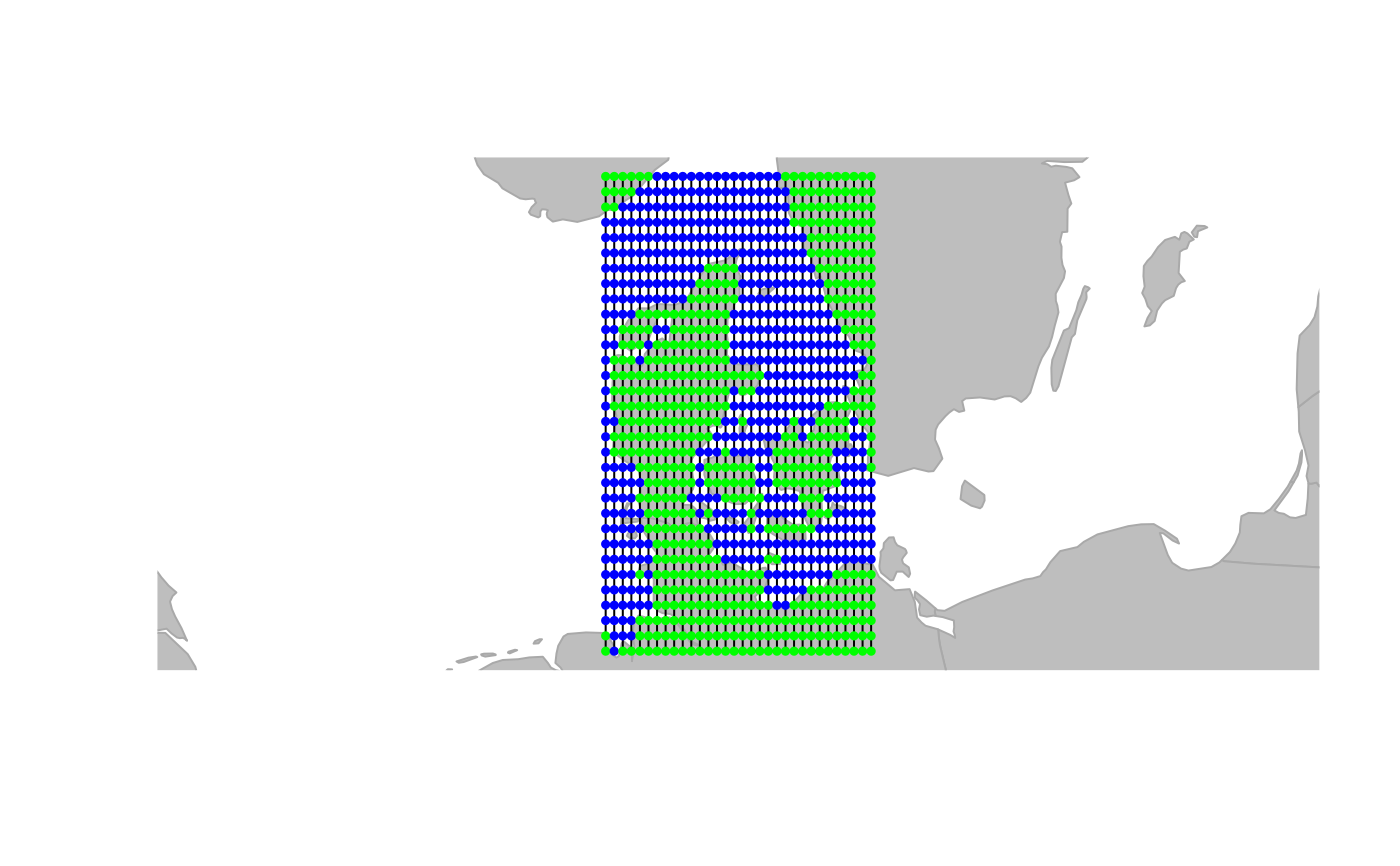
newGraph <- setColors(
newGraph,
col.rules = data.frame(
habitat = c("sea", "land"),
color = c("blue", "green")
)
)
## plot the new gGraph
plot(newGraph, reset = TRUE, edge = TRUE)
#> Spherical geometry (s2) switched off
#> Spherical geometry (s2) switched on
# If no area is specified, currently plotted area is used
geo.zoomin(c(8, 13, 54, 58))
#> Error in h(simpleError(msg, call)): error in evaluating the argument 'x' in selecting a method for function 'plot': object 'squareGraph' not found
newGraph <- makeSquareGrid(1e3)
newGraph <- findLand(newGraph)
#> Spherical geometry (s2) switched off
#> although coordinates are longitude/latitude, st_intersects assumes that they
#> are planar
#> Spherical geometry (s2) switched on
newGraph <- setColors(
newGraph,
col.rules = data.frame(
habitat = c("sea", "land"),
color = c("blue", "green")
)
)
## plot the new gGraph
plot(newGraph, reset = TRUE, edge = TRUE)
#> Spherical geometry (s2) switched off
 #> Spherical geometry (s2) switched on