This method plots a gPath object, which is the output of the dijkstraBetween,
polygonBetween and dijkstraFrom functions.
Arguments
- x
a
gPathobject- col
a character string indicating a color or a palette of colors to be used for plotting edges.
- lwd
a numeric value indicating the width of edges.
- seed
an optional integer value to set the seed for random color generation when
col = "rainbow".- ...
further arguments passed to
geo.segments.
See also
Other plotting_methods:
plot-gData,
plot-gGraph
Examples
hgdp.sub <- hgdp[getData(hgdp)$Population %in%
c("French", "Balochi", "BantuKenya", "Papuan", "Pima")]
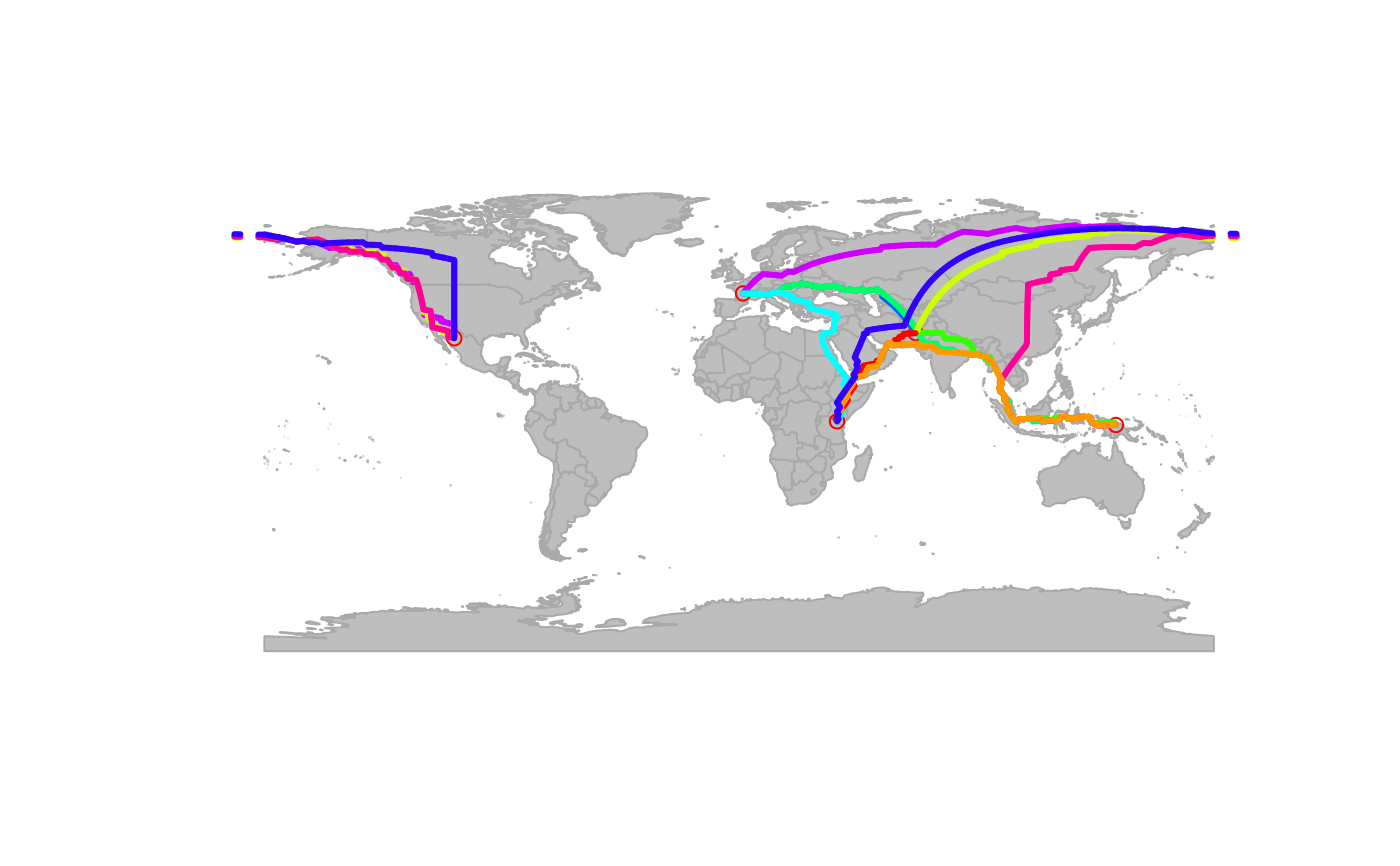
hgdp.path <- dijkstraBetween(hgdp.sub) # compute shortest path
## plotting
plot(worldgraph.40k, reset = TRUE, pch = "")
#> Spherical geometry (s2) switched off
#> Spherical geometry (s2) switched on
points(hgdp.sub, lwd = 1) # plot populations
plot(hgdp.path) # plot the path
 ## printing
print(hgdp.path)
#>
#> === gPath object ===
#>
#> number of paths: 10
#>
#> available paths (id_origin:id_destination): 24988:16798 24988:7348 24988:40768 ...
#>
#> each path, accessible with [[]] has elements 'length', 'path_detail' and 'length_detail'
#> x and y coordinates of all nodes are stored as an attribute 'xy'; see ?gPath for details
################
# plot method
################
## printing
print(hgdp.path)
#>
#> === gPath object ===
#>
#> number of paths: 10
#>
#> available paths (id_origin:id_destination): 24988:16798 24988:7348 24988:40768 ...
#>
#> each path, accessible with [[]] has elements 'length', 'path_detail' and 'length_detail'
#> x and y coordinates of all nodes are stored as an attribute 'xy'; see ?gPath for details
################
# plot method
################