For gt_admix, the following types of plots are available:
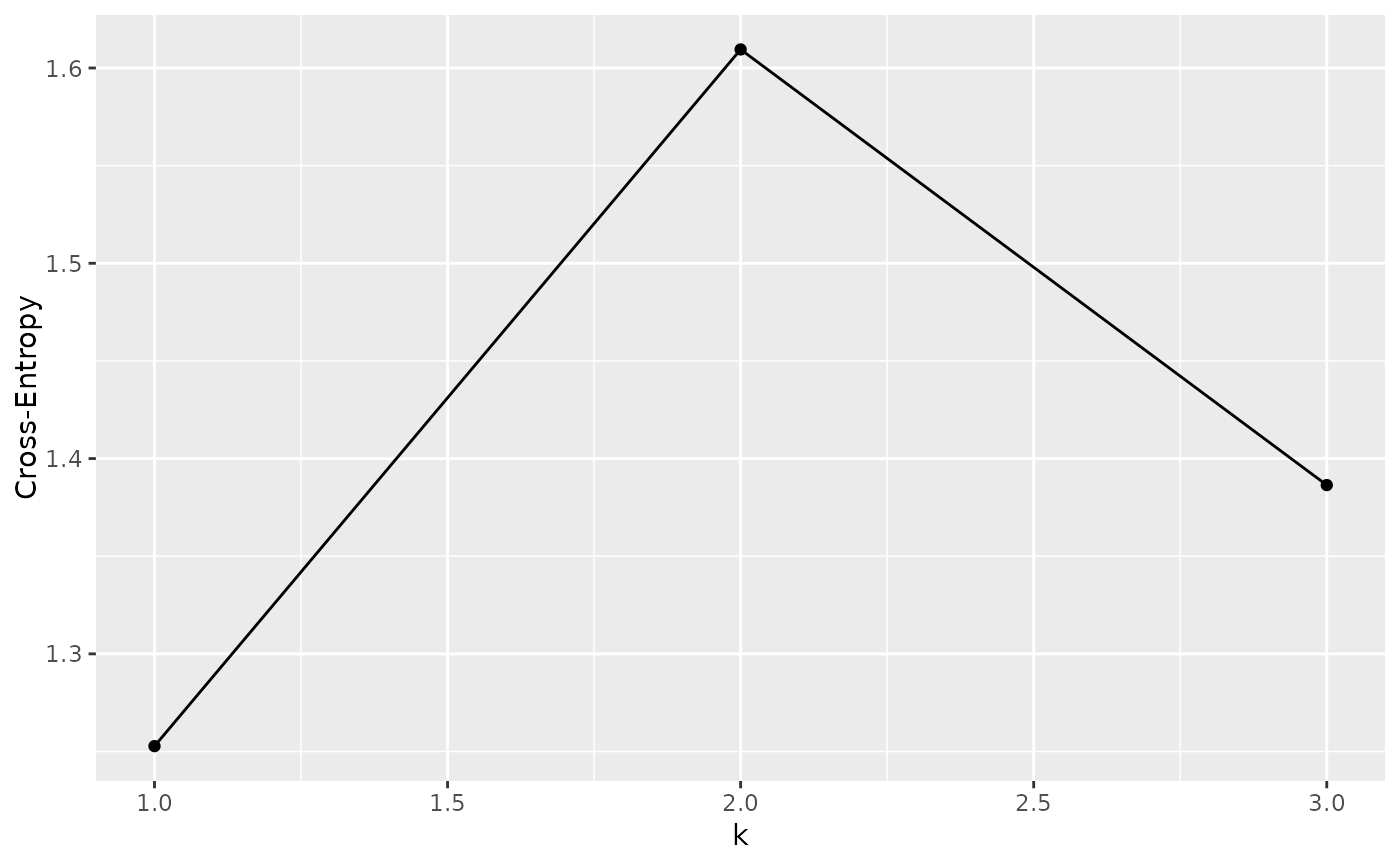
cv: the cross-validation error for each value ofkbarplota standard barplot of the admixture proportions
Arguments
- object
an object of class
gt_admixture- type
the type of plot (one of "cv", and "barplot")
- k
the value of
kto plot (forbarplottype only) param repeat the repeat to plot (forbarplottype only)- run
the run to plot (for
barplottype only)- ...
additional arguments to be passed to autoplot method for q_matrices
autoplot_q_matrix(), used when type isbarplot.
Details
autoplot produces simple plots to quickly inspect an object. They are not
customisable; we recommend that you use ggplot2 to produce publication
ready plots.
This autoplot will automatically rearrange individuals according to their id
and any grouping variables if an associated 'data' gen_tibble is provided. To
avoid any automatic re-sorting of individuals, set arrange_by_group and
arrange_by_indiv to FALSE. See autoplot.q_matrix for further details.
Examples
# Read example gt_admix object
admix_obj <-
readRDS(system.file("extdata", "anolis", "anole_adm_k3.rds",
package = "tidypopgen"
))
# Cross-validation plot
autoplot(admix_obj, type = "cv")
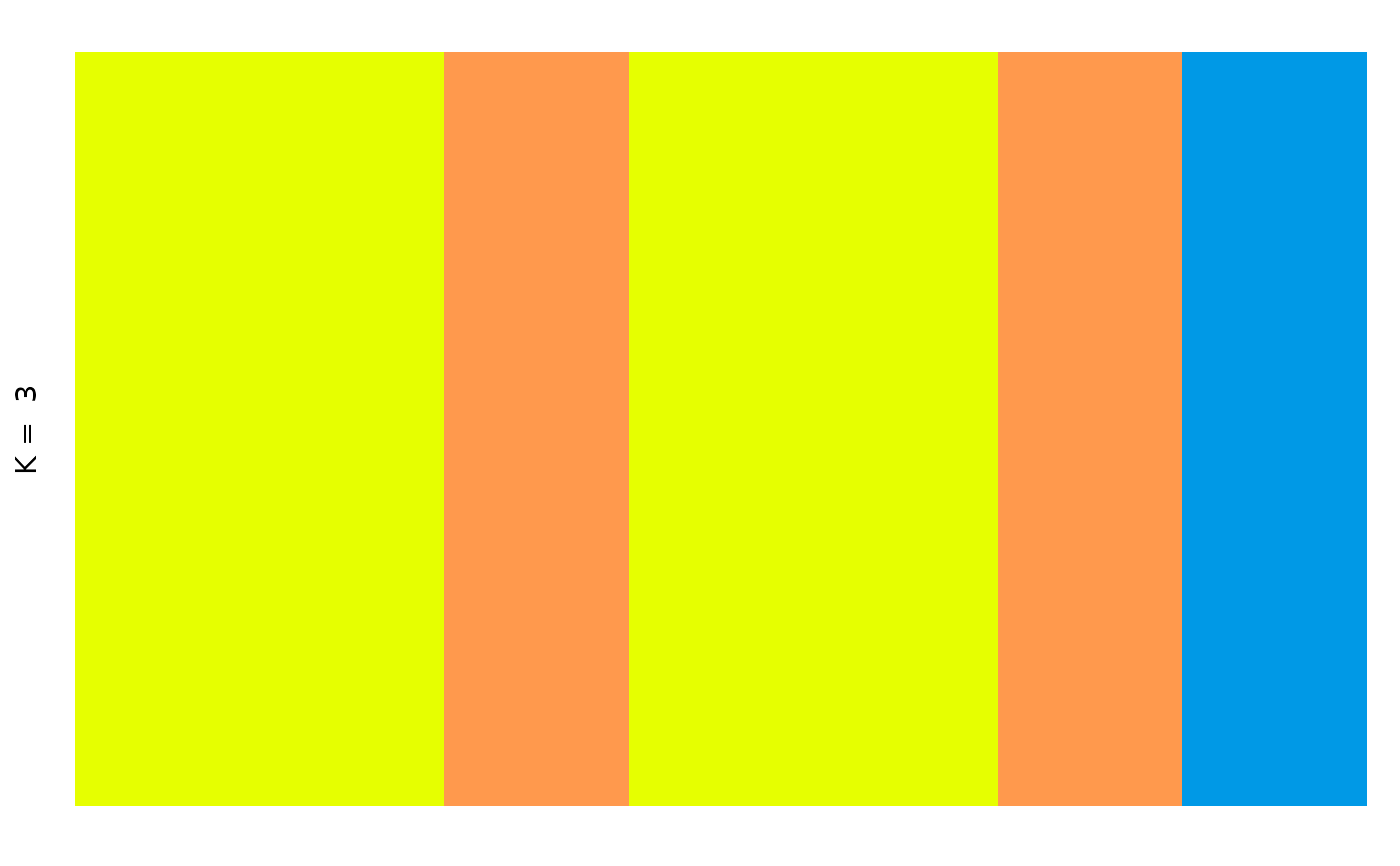
 # Basic barplot
autoplot(admix_obj, k = 3, run = 1, type = "barplot")
# Basic barplot
autoplot(admix_obj, k = 3, run = 1, type = "barplot")
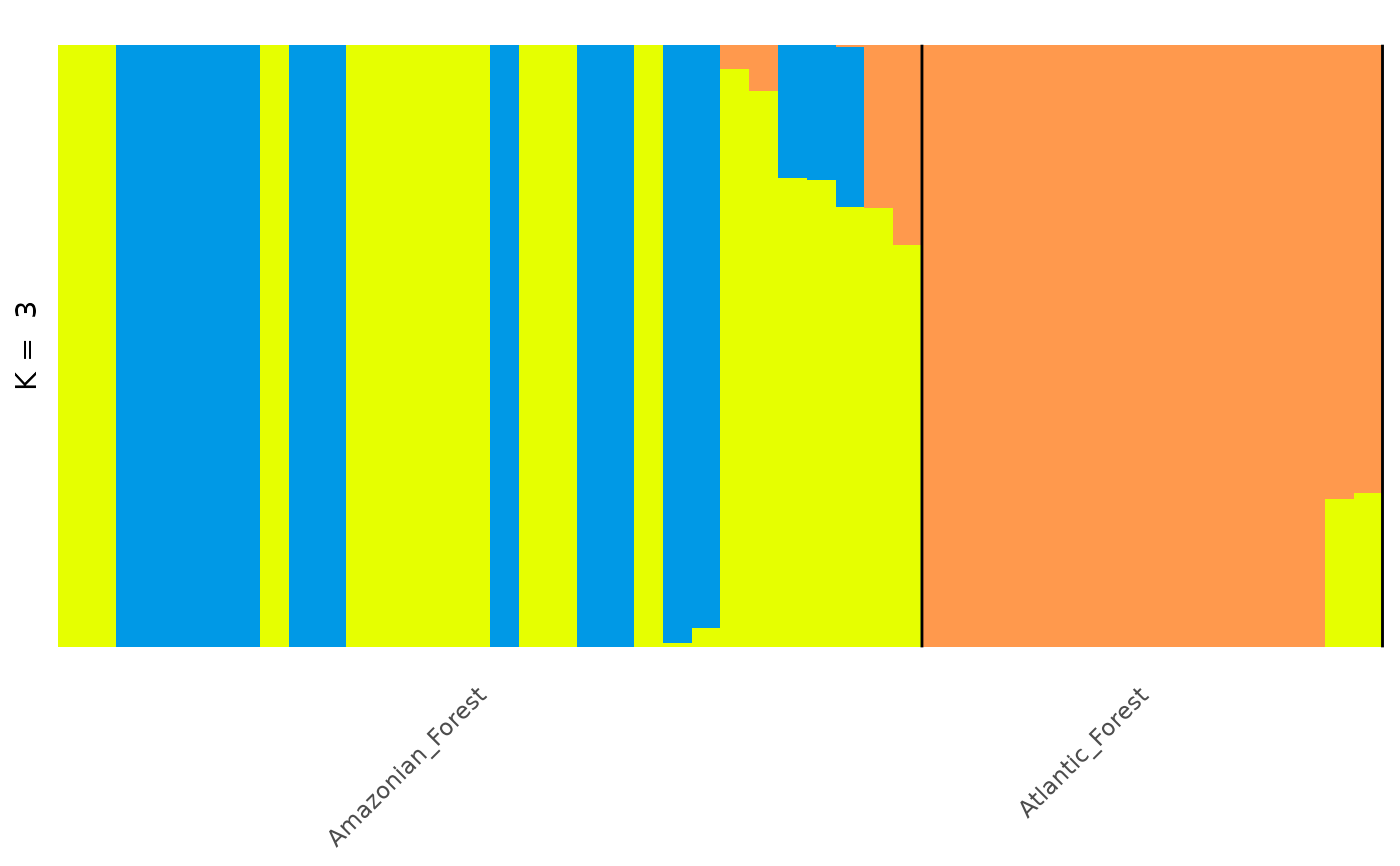
 # Barplot with individuals arranged by Q proportion
# (using additional arguments, see `autoplot.q_matrix` for details)
autoplot(admix_obj,
k = 3, run = 1, type = "barplot", annotate_group = TRUE,
arrange_by_group = TRUE, arrange_by_indiv = TRUE,
reorder_within_groups = TRUE
)
# Barplot with individuals arranged by Q proportion
# (using additional arguments, see `autoplot.q_matrix` for details)
autoplot(admix_obj,
k = 3, run = 1, type = "barplot", annotate_group = TRUE,
arrange_by_group = TRUE, arrange_by_indiv = TRUE,
reorder_within_groups = TRUE
)